The Other Transit Crisis: How to Improve the NYC Bus System
Executive Summary
The bus system is the workhorse of New York City public transit, serving residents of all ages, ethnicities, and income levels across all five boroughs. Its size and scope is unparalleled, with 5,700 buses, 330 routes, and 16,000 stops serving well over two million passengers each day—more than the combined daily ridership of LIRR, MetroNorth, PATH, and New Jersey Transit.[i]
The bus system is also the future of New York City public transit, connecting emerging job hubs outside of lower-Manhattan that are ill-served by the subway’s hub-and-spoke network. As the New York City economy diversifies, its fastest growing industries—health, education, hospitality, food services, culture—are also its most diffuse. For these sectors, buses are essential to the livelihood of their employees, clients, and customers and to their future success.
And yet, despite its extraordinary size, reach, and importance, the bus system is too often neglected. Within the sprawling Metropolitan Transportation Authority (MTA), it is overshadowed by subways, commuter rail, and bridges, which enjoy more attention and resources. Within the City—which oversees the roads, curbs, shelters, and traffic lights that buses depend upon—it receives abundant rhetorical support, but too little substantive assistance.
As a result, the bus system has been stifled. Its routes are often slow, unreliable, long, meandering, confusing, congested, and poorly connected. Its buses are old, its shelters deficient, and access to its stops and separated lanes are under-enforced. Its network is stagnant, changing little in recent decades despite an extraordinary transformation in residential, employment, and commuting patterns throughout the five boroughs.
This is not the result of unavoidable circumstances, but rather a product of age-old institutional failures by the City and the MTA to maximize the system’s potential. While bus riders demand fast, reliable, frequent, connective, accessible, and legible public transit, that basic level of service is too rarely on offer. As this report from New York City Comptroller Scott M. Stringer documents:
The MTA bus system is in decline:
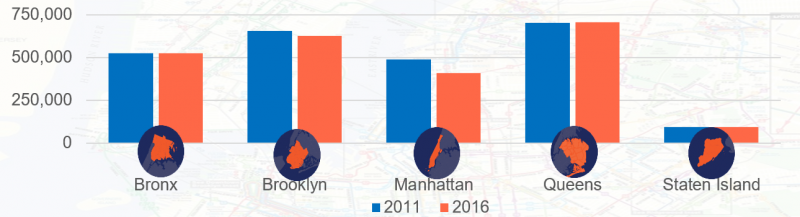
- The MTA bus system lost 100 million passenger trips in the last eight years. Falling ridership has largely been concentrated in Manhattan, down 16 percent since 2011, and Brooklyn, which fell by four percent.[ii]
MTA buses are the slowest in the nation among large cities:
- The average New York City Transit bus travels a dismal 7.4 miles per hour along its local, SBS, and express routes – slowest among the 17 largest bus companies in the nation.
- The typical New York City bus spends only half its time in-motion/in-traffic. Another 21 percent is spent at red lights and 22 percent at bus stops.[iii]
- Average bus speeds vary dramatically among the boroughs, with the slowest average speeds in Manhattan (5.5mph), Brooklyn (6.3mph), and the Bronx (6.5mph). This is significantly lower than local routes in Queens (8.1mph) and Staten Island (11.4mph).[iv]
Lower-income and immigrant New Yorkers are hurt by this lack of service most of all:
- The average personal income of bus commuters is $28,455 – far lower than subway commuters ($40,000) and employed New Yorkers as a whole ($38,840).[v]
- 55 percent of bus commuters are foreign born and 75 percent are people of color—significantly higher than subway commuters and New Yorkers more generally.
This decline is happening at a time when New York City’s economy and neighborhoods are changing and the need for a responsive bus system is greater than ever, especially outside of Manhattan:
- New York City subways were largely built to bring workers to Manhattan. But residents throughout the city are now more likely to commute within their home borough than to Manhattan, making an efficient, well-planned bus system essential.
- From 2006 to 2016, the number of jobs located in Brooklyn jumped by 49 percent, in the Bronx by 35 percent, in Queens by 34 percent, and in Staten Island by 27 percent, but only 5 percent in Manhattan. As a result of this growth, the share of New York City jobs located outside of Manhattan rose from 35 percent to 42 percent over this period.
- From 2000 to 2015, the number of Bronxites commuting within their home borough jumped 48 percent, Brooklynites by 41 percent, Queens residents by 34 percent, and Staten Islanders by 30 percent.
- As new employment centers emerge outside of Manhattan, the bus system has not kept pace. Neighborhoods like Williamsburg, Morris Park, Norwood, Greenpoint, Glen Oaks, Red Hook, and the two Queens airports provide thousands of jobs, but are underserved by public transit.
- Residential patterns have also changed, with rising rents dramatically altering the racial, ethnic, income, and occupational makeup of many neighborhoods. Bus routes have not, however, been relocated to serve their dislocated clientele.
- At the same time, many workers—especially in the service sector—are now commuting to and from work in the late evening, early morning, and at other non-traditional times when MTA bus service is limited. In fact, at its morning peak, the MTA runs 12 times more buses than during its late-evening nadir.[vi]
Declining bus service is due, in part, to the MTA’s failure to follow its own standards and schedules:
- In order to keep buses moving, the MTA aims to locate bus stops at least 750 feet apart.[vii] This standard is very low compared to other major cities and it is applied very loosely by the MTA. On ten routes, for instance, bus stops are spaced more than 1,200 feet apart, or nearly double the standard, which can make access difficult for seniors and the disabled. Meanwhile, 30 percent of routes do not maintain even this minimum standard.[viii] In fact, among Manhattan bus routes, the average distance between bus stops is 757 feet, barely higher than the recommended minimum.
- According to the MTA’s twelve-year bus replacement standards, the average vehicle should be 6 years old. In fact, the average age of an MTA bus is 7.8 years, and 22 percent are still on the road after a dozen years.[ix]
- The MTA has expressly acknowledged that long and meandering bus routes are inefficient and unreliable.[x] Yet local routes remain highly circuitous, with 38 making at least 15 turns and the average Staten Island route making 13. Meanwhile, the average city bus route is 6.8 miles long and in Staten Island, 10.6 miles.[xi]
- To measure the consistency of bus service, the MTA uses a “wait assessment” measure. By this metric, buses are considered unreliable if they do not maintain regular spacing along their route. Yet across the New York City Transit system, nearly a quarter of buses do not provide steady service during the weekday. Approximately 24 percent of Brooklyn and Manhattan local buses, 23 percent of Bronx buses, 21 percent of Queens buses, and 19 percent of Staten Island buses fail to maintain scheduled spacing during the day.[xii]
The bus system is also hampered by a fractured management structure:
- The bus system’s management is divided between two agencies: New York City Transit (NYCT) Bus and the MTA Bus Company.
- The operating costs per passenger for the NYCT Bus ($3.98) and MTA Bus Company ($5.48) ranks them 7th and 14th among the 17 largest city bus companies in the United States.[xiii]
- The MTA Bus Company and NYCT Bus operate separate depots. This leaves some NYCT buses traveling a farther distance to and from their route rather than being stored and maintained at a more proximate MTA Bus Company depot.
- NYCT Bus ranks 13th and MTA Bus ranks 17th in their share of “deadhead hours”—or the time its buses spend without serving customers—among the 17 largest city bus companies in the United States. This is largely due to the volatility of bus frequencies throughout the day as well as separate and scattered depots.[xiv]
Both the MTA and City DOT have struggled to implement new technologies and core amenities that could improve the speed and reliability of bus service:
- Dedicated Bus Lanes: In total, there are only 104 miles of dedicated bus lanes along the City’s 6,000 miles of roadway.[xv] This is far lower than the share of bus lanes in other major cities like Brussels, Barcelona, Dublin, Seattle, Singapore, and Lisbon.[xvi]
- Transit Signal Priority (TSP): Transit Signal Priority is a technology that allows MTA buses to communicate with New York City Department of Transportation (DOT) traffic lights in order to extend a green light or shorten a red light at an approaching intersection, allowing for swifter travel.
- After a decade of fitful efforts, TSP is active at a meager 260 intersections along only five of the city’s 326 bus routes.[xvii] This is far lower than London, where it has been installed at 3,200 intersections, Los Angeles, where it is active at 654, or Brussels, Dublin, Barcelona, Seattle, Montreal, Sydney, and Zurich, where a much higher percentage of traffic signals are equipped.
- Select Bus Service (SBS): SBS was supposed to herald a new day in NYC bus travel, with innovations like dedicated bus lanes and off-board fare collection. Outcomes, however, have been underwhelming, largely due to a failure to maintain SBS design standards and a lack of enforcement to keep dedicated lanes clear. In fact:
- NYC DOT will finish the year with only 15 of the 20 SBS routes it planned to implement by the end of 2017.
- Of the nine SBS routes introduced prior to 2016, five have experienced a ridership decline.[xviii]
- SBS routes travel at an average speed of 8.7 miles per hour, or just slightly better than the seven miles per hour achieved by local buses.[xix]
- City-wide, SBS routes fail to maintain steady, evenly spaced service 19 percent of the time, while local buses fail 22 percent of the time.
- Bus Shelters: Of the 15,000-plus bus stops across the five boroughs, only 3,364 have shelters, or 22 percent of the total. Staten Island has the smallest share of bus stops with shelters (12 percent), followed by Queens (20 percent), Brooklyn (21 percent), Bronx (28 percent), and Manhattan (32 percent).[xx]
The following nineteen recommendations provide a blueprint for the fast, frequent, and reliable bus system that New Yorkers deserve. Guided by this plan, the City and MTA can reduce commute times, improve access to good paying jobs, alleviate gaps in the subway system, ease subway overcrowding, and dramatically improve the lives of all New Yorkers.
Recommendations |
|
|
|
Economic Growth, Commuting Patterns, and the Demographics of Bus Ridership
New York City has never been more bustling, productive, or congested. Over 8.5 million people wake up in the city each morning, 4.4 million commute to work each day, and 60 million explore its sites each year. In the last decade, the city has added 300,000 residents, 700,000 jobs, and 16 million tourists.[xxi]
This extraordinary surge in activity is enabled and sustained by public transportation. From subways to ferries, commuter rail to paratransit, tramways to bike-share, the city’s roads, bridges, tunnels, waterways, and skies offer a variety of methods for circulating the city.
None of these transit modes, however, have the reach of the bus system, which operates in every neighborhood in New York City. In 2016, the MTA’s 5,700 buses picked-up 760 million passengers at 15,400 stops along 330 routes in every corner of the five boroughs.[xxii] Collectively, its operating budget was nearly $4 billion.[xxiii]
And yet, despite its formidable size, the bus system is too often relegated to second-class status by the MTA, which manages the system, and the New York City DOT, which oversees the roads, curbs, shelters, and traffic lights where MTA buses operate.
This status is most apparent in juxtaposition to the subway system. When subway ridership took a modest 0.3 percent dip in 2016 after six years of uninterrupted growth – and a quarter century of steady increases—alarm bells were set off throughout the city and countless theories were put forth. When the bus system lost 100 million riders over the last eight years (see Chart 1), no such introspection materialized.[xxiv]
Chart 1: MTA bus ridership, 2006-2016
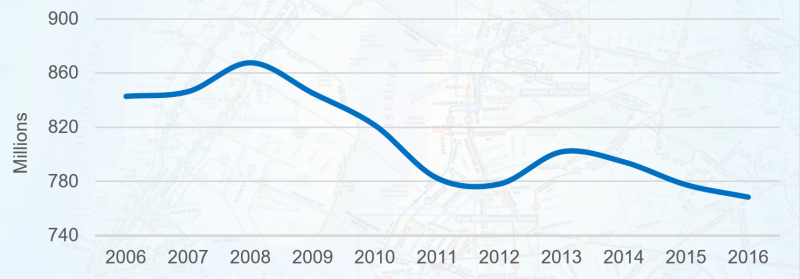
Metropolitan Transportation Authority, “MTA Adopted Budget: February Financial Plan,” 2007 to 2017.
Within the MTA, responsibility for the city’s underperforming bus system is divided between two companies: NYCT Bus and MTA Bus Company.[xxv]
NYCT Bus is significantly larger, providing a wide range of local and express inter-borough routes, as well as Select Bus Service (SBS)—upgraded lines with off-board fare collection, dedicated bus lanes, and other innovations to expedite service. MTA Bus Company, on the other hand, is primarily engaged in express service to Manhattan, though it does run several local routes, particularly in Queens.
While the two companies manage overlapping networks, their operations are largely divided. Thirteen years after the acquisition of MTA Bus, route planning and scheduling is still conducted with little collaboration.
The City, meanwhile, has failed to devote the energy and resources to help turn around the flagging bus system. NYC DOT will finish the year with only 15 of the 20 Select Bus Service routes it promised by the end of Mayor de Blasio’s first term in office.[xxvi] The implementation of Transit Signal Priority, which adjusts traffic lights to speed bus travel, has been slow and coordination with the MTA is increasingly constrained. Bus stops are poorly marked and sidewalk extensions—important for expediting boarding—are rare, with construction often over-schedule and over-budget. Enforcement of bus lane and bus stop obstructions, the dominion of both DOT and NYPD, is meager.
This should not be the case. The bus system is an essential (and enormous) component of the city’s public transportation network. An effective, well designed system could reduce commute times, improve access to jobs, ease subway overcrowding, alleviate gaps in the subway system, and dramatically improve the lives of all New Yorkers, particularly those with lower incomes.
Job Growth Outside of Manhattan and Changing Commuting Patterns
More than any other transit mode, the bus system should have the capacity and flexibility to accommodate the city’s residential and employment growth and changing commuting patterns.
While the subway is a fixed, hub-and-spoke system, designed to quickly transport residents from upper-Manhattan and the non-Manhattan boroughs into the downtown and midtown business districts, bus routes are (theoretically) more adaptive. They can be redesigned as commuting patterns evolve—servicing the growing number of residents whose jobs are located within their home borough or in an adjacent non-Manhattan borough.
Over the last decade, these “non-Manhattan” boroughs have experienced tremendous economic growth. From 2006 to 2016, the number of jobs located in Brooklyn jumped by 49 percent, in the Bronx by 35 percent, in Queens by 34 percent, and in Staten Island by 27 percent, but only five percent in Manhattan (see Chart 2).[xxvii] As a result of this growth, the share of New York City jobs located outside of Manhattan rose from 35 percent to 42 percent over this period.
Chart 2: Employment growth within the boroughs, 2006 to 2016
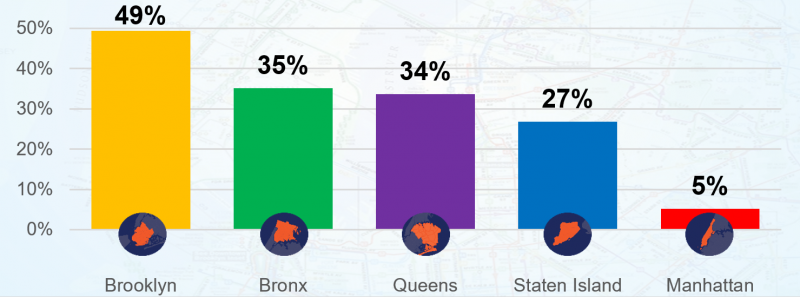
New York State Department of Labor, “Quarterly Census of Employment and Wages.”
Not surprisingly, the changing geography of jobs has had a major impact on commuting patterns. From 2000 to 2015, the number of Bronxites commuting within their home borough jumped 48 percent, Brooklynites by 41 percent, Queens residents by 34 percent, and Staten Islanders by 30 percent (see Chart 3). Meanwhile, the number of residents working in another, non-Manhattan borough jumped by 34 percent in the Bronx, 14 percent in Brooklyn, and 11 percent in Queens, while dropping in Staten Island by four percent (see Chart 3).[xxviii]
Chart 3: The number of residents commuting within their home borough or to another non-Manhattan borough grew significantly between 2000 and 2015
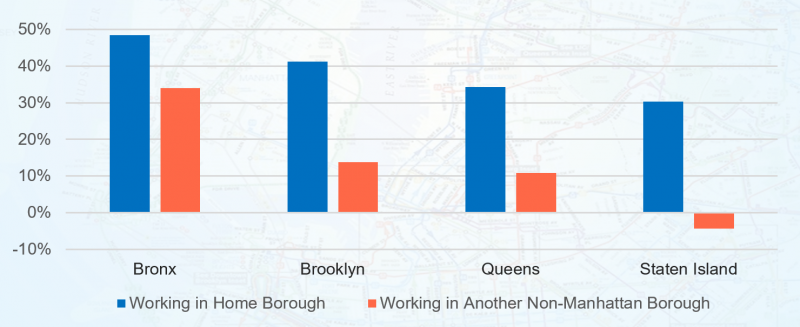
United States Census Bureau. American Community Survey 2011-2015 5-Year Estimates.
As a result of these developments, residents of every borough are now more likely to commute within their home borough than to Manhattan. Meanwhile, a substantial portion of commuters are traveling between non-Manhattan boroughs (see Chart 4).
Chart 4: Where do borough residents commute?

United States Census Bureau. American Community Survey 2011-2015 5-Year Estimates.
The New York City bus system should be responsive to these rapidly evolving, decentralized commuting patterns. A new or modified bus route requires neither billion dollar stations nor elaborate tunneling. As employment and residential hubs disperse, the direction, frequency, and span of bus lines can conceivably be altered with only minimal capital outlay.
In practice, however, bus maps remain fairly stagnant. A route’s timetable may be modified to accommodate ridership changes, its path may be tweaked, and, in rare instances of budgetary shortfalls or windfalls, a route may be added or eliminated altogether. But these changes are atypical and executed in isolation, with little consideration for the performance and connectivity of the system as a whole.
Rare instances of comprehensive planning, meanwhile, have ultimately proven tepid and toothless. In the 1980s, the MTA pursued extensive bus route analyses within each of the five boroughs, but ultimately tabled these studies and implemented few of their recommendations.
Such an undertaking has not been conducted since—with the exception of the current, and exemplary, efforts to redesign Staten Island express bus routes. As a consequence, the city’s bus maps bare a strong resemblance to the trolley lines of yesteryear in many neighborhoods.
The Bus System and Lower-Income New Yorkers
A robust, responsive, and well-funded bus system is particularly vital for low-income New Yorkers, whose jobs are highly decentralized. While 63 percent of New York City jobs with an annual salary over $40,000 are located in lower Manhattan, only 38 percent of lower-wage jobs can be found there.[xxix] The remaining 62 percent are scattered throughout the five boroughs (see Chart 5), leaving lower-income workers with exceedingly long commutes and often dependent on private automobiles which are expensive to buy, maintain, insure, and park in New York City.
Chart 5: While higher-wage jobs are highly concentrated in lower Manhattan, lower-wage employment is scattered throughout the five boroughs
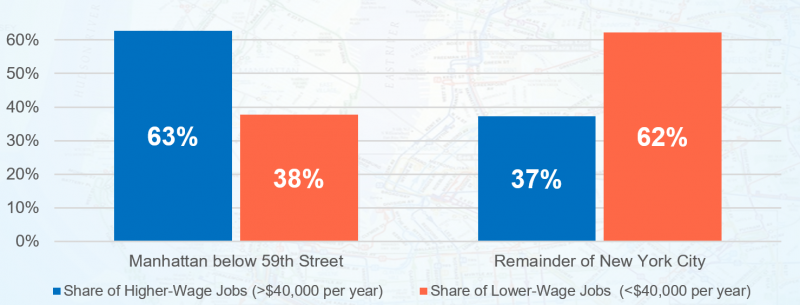
United States Census Bureau. “LEHD Origin-Destination Employment Statistics.” 2015.
In fact, nearly 50 percent of New Yorkers with lower-wage jobs own an automobile and 24 percent commute to work using a car—far higher than the 14 percent that commute to work via bus.[xxx] Thus, while lower-income commuters are often labelled as “transit-dependent” or “captive” riders by transportation planners, their commuting behavior suggests that this is not the case. Improving bus service, then, has the ability to reduce commuters’ needs for private vehicles, allowing many lower-income New Yorkers to forego car ownership and save thousands of dollars.
Bus commuters, meanwhile, are among the most economically vulnerable living in New York—with less income and less education than both subway commuters and city residents writ-large. The average personal income of bus commuters is $28,455—far lower than subway commuters ($40,000) and employed New Yorkers as a whole ($38,840). Nearly 70 percent of bus commuters do not have a bachelor’s degree, 12 percent are over 60, 42 percent have children at home, 17 percent are single parents, 55 percent are foreign born, and 75 percent are people of color—all significantly higher than subway commuters and New Yorkers more generally (see Table 1).[xxxi]
Table 1: Profile of New Yorkers commuting to work
| Bus Commuters | Subway Commuters | All New Yorkers | |||
| Median Income (of employed) | $28,455 | $40,000 | $38,840 | ||
| Bachelor’s Degree or Higher (Age 25+) | 31% | 48% | 36% | ||
| Share of Working Population that is age 60+ | 12% | 8% | 10% | ||
| Parent (age 16+) with Children at Home | 42% | 33% | 36% | ||
| Single Parent (age 16+) | 17% | 10% | 12% | ||
| Foreign Born | 55% | 49% | 41% | ||
| Person of Color | 75% | 66% | 67% | ||
| Work in Healthcare, Hospitality, Retail, Food Services, or Cultural industries | 49% | 38% | 38% | ||
United States Census Bureau. American Community Survey 2011-2015 5-Year Estimates.
These riders are also disproportionately employed in industries with “non-traditional work hours,” like healthcare, hospitality, retail, food services, and culture.[xxxii] They require frequent and reliable bus service at all times of the day, not just rush hour.
From 2006 to 2016, the number of jobs in these “non-traditional” industries grew by 32 percent—far outpacing employment growth in the remainder of city industries (14 percent). Healthcare, hospitality, retail, food services, and culture now account for 40 percent of private sector jobs and employ 1,448,303 workers.
For these service-sector employees—and their millions of customers and clients—bus service is often inadequate. Just as shifts are ending or rotating, the availability of buses is plummeting throughout the city. At its AM peak, for instance, the MTA runs twelve times more buses than during its late-evening nadir (see Chart 6).
Chart 6: The number of buses beginning their route each hour

NYCT Bus and MTA Bus. “Static Data Feeds: General Transit Feed Specification,” MTA. January 2017.
The Cost of Bad Service
Building a bus system that gets New Yorkers where they want to go, when they want to go will benefit straphangers, increase ridership, and improve the bottom line.
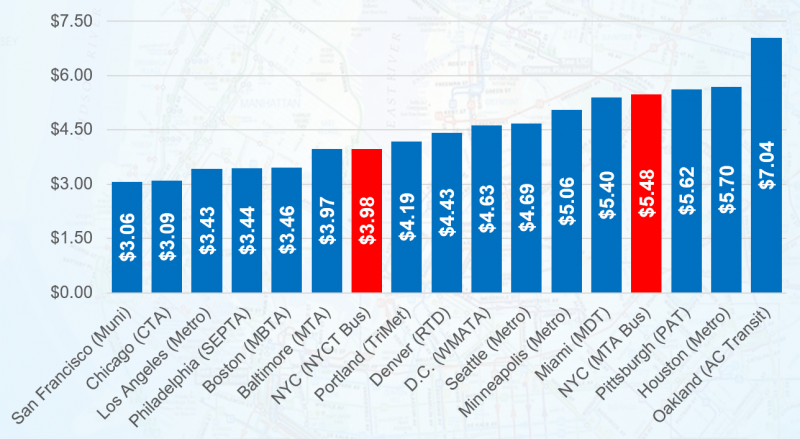
In 2016, the MTA Bus and NYCT Bus Company collected only 31 cents in farebox revenue for every operating dollar expended—their “farebox recovery ratio.” While this placed them favorably among the nation’s 17 bus companies with over $250 million in expenses—behind only Chicago Transit Authority—this was due, in part, to the MTA’s relatively high bus fare. Adjusting for this variation in fares, New York City Transit Bus ranked 7th among its peers in operating cost per passenger trip while the MTA Bus Company ranked 14th (see Chart 7).[xxxiii]
Chart 7: Operating cost per passenger trip among 17 largest urban bus companies
National Transit Database. “Metrics,” 2016. Includes “bus,” “commuter bus,” and “bus rapid transit” services.
Regardless of the preferred metric, the financial circumstances for the MTA are clear: when fare revenue does not cover operating expenses, there is an operating loss. For NYCT Bus, this loss was nearly $2.2 billion in 2016. For the much smaller MTA Bus Company, it was in excess of $475 million.[xxxiv]
And while deficits are inevitable for any major city bus system, they can be minimized by adapting to the needs of passengers. Revising routes to more directly, quickly, and reliably serve changing commuting patterns and emerging employment centers will not only improve the economic conditions and quality-of-life of New Yorkers, it will also attract increased ridership and improve the finances of the bus system.
New Geography of Jobs: Gaps in Service and Ridership Trends in New York City
Though it may lack in responsiveness and adaptiveness, the New York City bus network is thoroughly comprehensive. MTA service spans every borough and reaches every neighborhood—with the express intention that no New Yorker should walk more than a quarter-mile to the closest bus shelter or subway station.[xxxv]
In addition to this “coverage” goal, both NYCT Bus and MTA Bus Company, strive to provide service that gets people where they want to go, when they want to go, in a reasonable amount of time. Achieving this aim requires direct, frequent, and reliable service that prioritizes dense population centers and employment hubs—as well entertainment, education, and healthcare destinations.
Over the last quarter century, the geographic diffusion of business and employment in New York City has left many of these hubs underserved. Areas like Williamsburg in Brooklyn, Morris Park in the Bronx, and the two airports in Queens each support over 20,000 jobs across a broad range of skills.[xxxvi] While this is far higher than the typical New York City neighborhood, each area is served by fewer than the average number of subway lines and bus routes.
In total, there are 12 neighborhoods (and two airports) that offer significantly more jobs, but have significantly less bus (and subway) service than the average city neighborhood (see Table 2).[xxxvii] Each are compelling candidates for additional bus service:
Table 2: Ample employment opportunities, but inadequate transit service
| Neighborhood | Total Jobs | Bus Routes | Buses per AM peak |
Subway Lines |
| Clinton | 65,820 | 16 | 146 | 2 |
| JFK and LaGuardia | 40,345 | 10 | 167 | 1 |
| Williamsburg (aka North Side-South Side) | 27,193 | 11 | 142 | 2 |
| Van Nest-Morris Park-Westchester Square | 20,264 | 12 | 150 | 1 |
| Norwood | 16,473 | 11 | 148 | 2 |
| Greenpoint | 14,473 | 5 | 51 | 1 |
| Richmond Hill | 14,396 | 10 | 152 | 1 |
| Carroll Gardens-Columbia Street-Red Hook | 14,311 | 15 | 107 | 2 |
| College Point | 13,851 | 9 | 111 | 0 |
| Jackson Heights | 13,513 | 11 | 166 | 1 |
| Sheepshead Bay-Gerritsen Beach-Manhattan Beach | 12,907 | 10 | 155 | 2 |
| Glen Oaks-Floral Park-New Hyde Park | 12,121 | 9 | 114 | 0 |
| Homecrest | 11,095 | 6 | 125 | 1 |
| Typical NYC Neighborhood | 6,944 | 13 | 174 | 2 |
Jobs: United States Census Bureau. “LEHD Origin-Destination Employment Statistics.” 2015.
Bus and Subway: MTA. “Static Data Feeds: General Transit Feed Specification,” January 2017.
Importantly, these neighborhoods are not just employment centers, but also destinations for shoppers, diners, tourists, nightlife, and health services. Morris Park, Norwood, and Glen Oaks house major hospital complexes. Williamsburg, Jackson Heights, and Clinton are renowned restaurant and retail locations (see Appendix 1).
Beyond jobs and attractions, the need for additional service to these neighborhoods is evident from ridership trends. While bus ridership has fallen substantially city-wide, many of the routes that traverse these neighborhoods have grown in popularity. Ridership among the local routes in College Point, for instance, rose 13 percent, those servicing the airports jumped by four percent, and those serving Norwood saw a three percent increase. As for the neighborhoods where ridership fell, they were almost exclusively in Brooklyn and Manhattan, where the average bus moves at haltingly slow speeds and reliability is patchy.
Chart 8: Average weekday ridership on local bus routes, 2011-2016
“Average Weekday Ridership” MTA New York City Transit and MTA Bus Company.
Ridership trends in these underserved neighborhoods are consistent with larger, city-wide patterns (see Chart 8). For instance, while local bus ridership has fallen dramatically in Manhattan (down 16 percent) and Brooklyn (down four percent), it has actually grown in Staten Island (3 percent), Queens (1 percent), and the Bronx (half a percent).
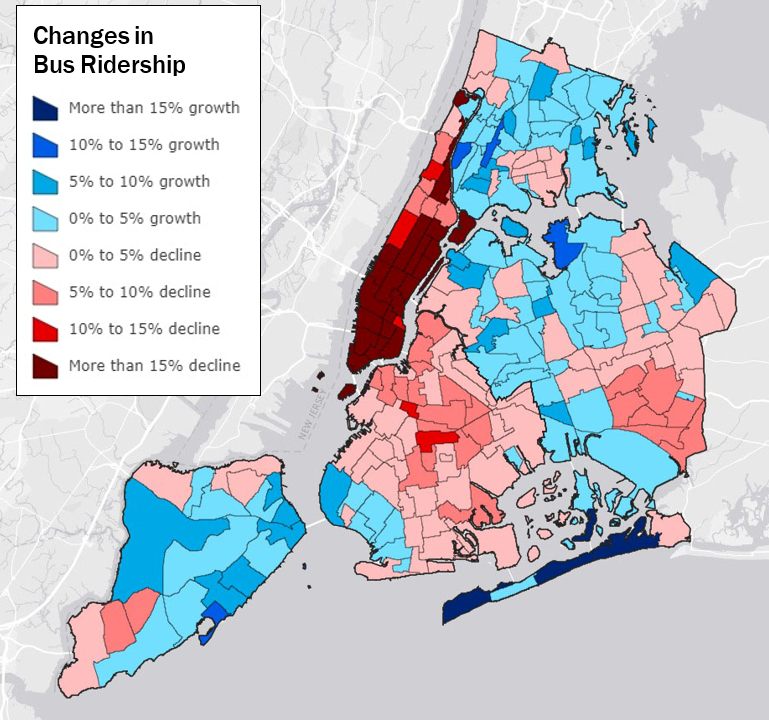
Drilling down to the neighborhood level (see Map 1), the number of areas experiencing ridership growth among local routes outnumbered those that experienced a fall in the Bronx (28 to 9), Queens (29 to 28), and Staten Island (12 to 6). The reverse was true in Brooklyn (8 to 42) and Manhattan (1 to 27).
Map 1: Changes in local bus ridership by neighborhood, 2011-2016
Location: NYCT Bus and MTA Bus Company. “Static Data Feeds: General Transit Feed Specification,” January 2017. Based on ridership on the routes that traverse each neighborhood.
Falling bus ridership in many of these Brooklyn and Manhattan neighborhoods is occurring in tandem with dramatic demographic changes. As rents rise and neighborhoods become increasingly unaffordable, the racial, ethnic, income, and occupational distribution of residents has been altered. In a number of neighborhoods, populations that once relied on buses to commute to local, lower-wage service sector jobs are now being displaced by residents who rely primarily on subways to commute to higher-wage jobs in the Manhattan central business districts.
Gentrification has, in fact, been strongly correlated with falling bus ridership in cities like Portland.[xxxviii] It appears to exert a similar influence in New York City neighborhoods. While thousands of local bus riders are being displaced by rising rents, bus routes have not been relocated to serve their dislocated clientele.
Recommendation 1: The MTA should initiate a comprehensive bus network review |
| New York City has experienced rapid population and employment growth over the last quarter century. Its neighborhoods have undergone dramatic changes, with new population and employment hubs emerging throughout the five boroughs. In light of this residential and economic transformation, the MTA should conduct a comprehensive review and realignment of its bus network to better serve contemporary commuting patterns.
Cities like Houston, Baltimore, and Portland have already completed major bus redesigns with great success. Los Angeles, Philadelphia, and Austin are currently planning redesigns as well.[xxxix] With the tremendous changes that New York City has experienced in the last quarter century, a reconsideration and reconfiguration of the bus map is long overdue. Given the vast size of the city’s bus system, work will need to be portioned into geographic units. While dividing these network redesigns by borough is one option, close consideration must be paid to improving inter-borough connectivity, which is currently deficient. However the work is apportioned, expectations should be clearly established at the beginning, with a comprehensive and transparent timetable for the entire process. |
Recommendation 2: The MTA Bus Company and New York Transit Bus should better coordinate their operations to improve service |
| In conjunction with a comprehensive review of the bus system, the MTA should better coordinate MTA Bus Company and NYCT Bus operations. Over a decade has passed since the Authority assumed control of the MTA Bus Company. While some progress has been made in unifying operations since that time, planning and scheduling remain separate.
These two systems have extensive overlap, particularly in Queens, and should not be treated separately. Routes must be designed and scheduled in tandem, ensuring maximum interconnectivity and complementarity. To carry out this bus network redesign, staffing in the unified planning division should be increased. |
Recommendation 3: City DOT should take a more pro-active role in helping to redesign the MTA bus network, and bus planning more generally |
| In 1978, the MTA introduced major changes to its Southwest Brooklyn bus routes. It was a rare instance of “comprehensive” planning, albeit in a small section of the city. This planning was not instigated, however, internally by the MTA, but by the Department of City Planning.
This initiative and intervention from the City should come as little surprise. Buses run on City streets, obey City traffic laws enforced by City police, stop at City traffic lights, and pull up at City curbs to City-franchised bus shelters. Given its impact and interest in a high-performing bus system, the City should be deeply engaged in a bus system redesign. The City DOT should create a bus planning division to lend research and outreach support and, during the implementation phase, seamlessly coordinate street improvements with route changes. Beyond the bus redesign, the DOT should take a more pro-active role in routing and scheduling decisions. This will allow the City to better align bus service enhancements with land use changes, and to better coordinate bus routing and street improvements. |
Infrequent, Unreliable, and Slow
Getting New Yorkers where they want to go is important. Getting them where they want to go, when they need to be there is essential. Unfortunately, the bus system does not always deliver on this promise.
To increase ridership and better serve commuters and job-seekers, New York needs a high-performing bus system. Buses should come regularly, so that wait and transfer times are short. They should come as scheduled, so that commuters can plan around their timetables and not be late for work, meetings, school, or appointments. They should move swiftly through traffic, so that commuters aren’t grinding through congested roads, wishing they’d driven, biked, or walked instead. Frequency, reliability, and speed—all are critical to an effective, thriving bus system.
Frequency
Of these core components, frequency is perhaps the most important. A bus that comes once an hour is of limited value to someone who is changing their plans on-the-go or just missed the bus they were trying to catch. While innovations like MTA Bus Time—an app that provides real-time information on bus locations and schedules—certainly improves trip planning and helps guard against missing the bus, frequency remains essential for limiting wait and transfer times and attracting both dedicated and casual ridership.
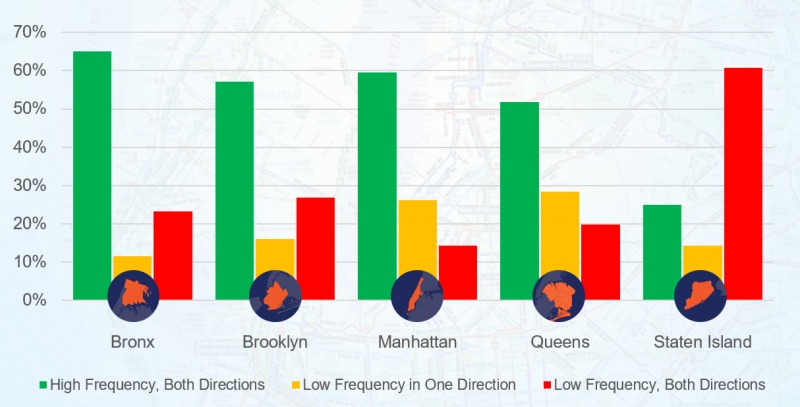
While the regularity of New York’s bus system far outclasses its American peers, there are dozens of routes that do not maintain “frequent” service during morning rush hour in one or both directions.[xl] Among the city’s 250 local, limited, and SBS bus routes, over 25 percent provide infrequent service, forcing riders to wait over 10 minutes between buses. Another 21 percent travel frequently in only one direction during the AM peak, generally toward a transit or employment hub.
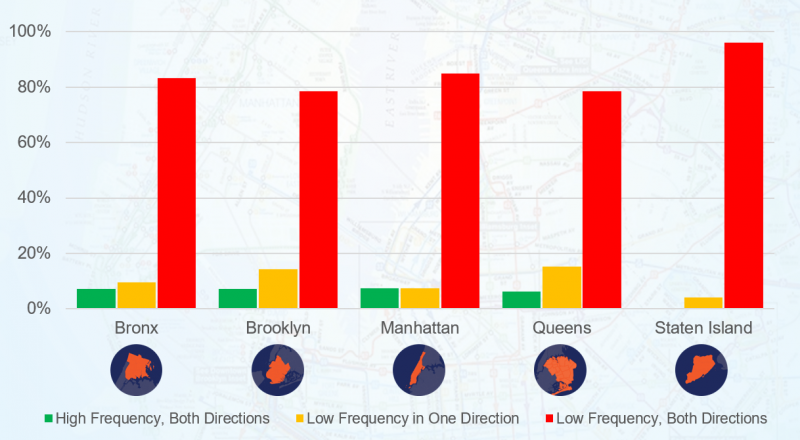
The regularity of service varies significantly by borough. Only 25 percent of bus routes in Staten Island maintain frequent service during morning rush hour in both directions. This compares to 52 percent in Queens, 57 percent in Brooklyn, 60 percent in Manhattan, and 65 percent in the Bronx (see Chart 9).
Chart 9: Share of bus routes with infrequent service during AM rush hour, by borough
NYCT Bus and MTA Bus Company. “Static Data Feeds: General Transit Feed Specification,” MTA. January 2017.
In 53 of the city’s 188 neighborhoods, less than half of the local, limited, and SBS routes that service the area provide frequent rush hour service in both directions. In ten neighborhoods, fewer than 20 percent of routes provide that level of service (see Table 2).
Table 2: Neighborhoods with a large share of infrequent bus routes
| Neighborhood | # of Local, Limited, SBS Bus Routes | High Frequency, Both Directions | High Frequency, One Direction | Low Frequency, Both Directions |
| Rossville-Woodrow, SI | 4 | 0 | 1 | 3 |
| Arden Heights, SI | 3 | 0 | 1 | 2 |
| Whitestone, QN | 7 | 1 | 2 | 4 |
| Brooklyn Heights-Cobble Hill, BK | 6 | 1 | 3 | 2 |
| SoHo-TriBeCa-Civic Center-Little Italy, MN | 6 | 1 | 2 | 3 |
| Todt Hill-Emerson Hill-Heartland Village-Lighthouse Hill, SI | 16 | 3 | 3 | 10 |
| Prospect Heights, BK | 5 | 1 | 2 | 2 |
| Charleston-Richmond Valley-Tottenville, SI | 5 | 1 | 1 | 3 |
| Mariner’s Harbor-Arlington-Port Ivory-Graniteville, SI | 10 | 2 | 1 | 7 |
| New Brighton-Silver Lake, SI | 15 | 3 | 1 | 11 |
NYCT Bus and MTA Bus Company. “Static Data Feeds: General Transit Feed Specification,” MTA. January 2017.
Of course, New Yorkers rely on the bus system outside of the morning rush hour. They go to grocery stores, bodegas, restaurants, movies, clubs, and cultural events in the evening and wee hours of the night (it is, after all, “the city that never sleeps”). When traveling to and from these destinations, they demand reliable and available public transit.
Even more important, a growing number of New Yorkers are working in industries with “non-traditional hours.” Many of these workers are low-paid and are particularly dependent on MTA service to get to and from their jobs.
Among bus routes that start between 8:30pm and 10:30pm, a mere six percent run frequently in both directions and 12 percent run frequently in one direction. In Staten Island, 96 percent of bus routes are infrequent in both directions, while 85 percent are infrequent in Manhattan, 83 percent in the Bronx, 79 percent in Brooklyn, and 78 percent in Queens (see Chart 10).
Chart 10: Share of bus routes with infrequent service in the evening, by borough
NYCT Bus & MTA Bus Company. “Static Data Feeds: General Transit Feed Specification.” January 2017.
Even in those neighborhoods with a large number of health, hospitality, retail, food services, and cultural businesses, evening bus service plummets. In the 30 neighborhoods supporting over 10,000 employees in these industries, an average of 104 buses/per hour pass through between 8:30pm and 10:30pm—compared to 255 during morning rush, a 59 percent fall (see Appendix 2).[xli]
These drop-offs are particularly galling in Forest Hills, Sunset Park, Chinatown, and Glen Oaks. Though half the jobs in these neighborhoods are in 24-hour, seven-day-a-week industries like healthcare and accommodations, bus service dips by more than 60 percent between morning rush and late evening hours each weekday. Just as shifts are starting, ending, or rotating, the availability of public transportation is plummeting.
And while some variation in peak and non-peak frequencies is common and advisable, the MTA has long been recognized as an outlier in this respect.[xlii] Its irregular service is highly inefficient, requiring buses to spend much of their time traveling to and from their depots, rather than continuing along their route. This produces a lot of “deadhead hours,” or the time a bus spends without serving customers.
Chart 11: Share of the time that buses are traveling, but not in service, by agency
National Transit Database. “Service,” 2016. Includes “bus,” “commuter bus,” and “bus rapid transit” services.
Compared to its peer bus companies in the United States, NYCT Bus ranks 13th and MTA Bus ranks 17th out of 17 in their share of deadhead versus revenue hours (see Chart 11). While a number of factors contribute to these inefficiencies—including the number of express routes and the location of depots—inconsistent bus frequencies certainly play a role.
Better accommodating the evolving industry landscape and travel patterns of New Yorkers, then, will not only make the system more accommodating to riders, it will also make it more efficient.
Recommendation 4: The MTA should increase the frequency of buses in off-peak hours and overhaul scheduling guidelines |
| While New York has long been known as the “city than never sleeps,” it is truer today than ever. Unfortunately, the MTA has not kept pace with the city’s changing employment and leisure patterns, as their bus frequencies plummet after AM and PM rush hours. This should be rectified, with more frequent service on routes serving dense corridors of retail, restaurant, health, hotel, and cultural businesses.
Importantly, the boost in off-peak frequencies should be coupled with a comprehensive review of the MTA scheduling, or “vehicle headway,” guidelines. At the moment, these service standards are entirely reactive to existing ridership, providing additional service only when buses are overcrowded. MTA scheduling guidelines fail, however, to consider latent (or “induced”) demand that accompany an increase in bus frequencies. For instance, a rider who would never rely on a bus that comes every 45 minutes, could be lured by higher-frequency service. (This is particularly true for riders working in the service-industries, where a number of variables can keep an employee later than expected, causing them to miss a scheduled bus. If the next one does not arrive for another 45 minutes, it is hardly a viable option.) Failure to consider induced demand also plagues the introduction of new bus routes. Recent additions like the M12, for instance, feature 30 minute headways. While the official Authority position is to explore how they perform and increase frequency accordingly, a route with 30 minute gaps is likely to fail from the outset. Moving forward, the MTA and Board should amend their “Vehicle Headway” guidelines to allow for more sophisticated analyses of latent ridership. They could draw from data sources beyond current ridership—like cell phone data or business employee data—to better understand travel patterns and optimize service. This will allow the MTA to proactively enhance service in order to stimulate ridership. |
Reliability
A 7:10am bus arrives at 7:04am. Dozens of on-time commuters trickle into the stop, quickly learning that they’ve been stranded by an off-schedule bus. Fourteen minutes later, the 7:20am arrives. Carrying a double-load, it is overcrowded and cannot accommodate everyone at the stop. Riders are left to wait for the 7:30am, which arrives five minutes late.
When buses fail to adhere to their schedule and maintain steady service, riders are adversely impacted. They are late for work, for school, for appointments, caretaking, pick-ups, drop-offs, and much more. A high-frequency network is of little value when buses run ahead or behind schedule. A bus system that is unreliable will struggle to retain and attract ridership.
To measure the consistency of bus service, the MTA uses a “wait assessment” measure. By this metric, buses are considered unreliable if they do not maintain regular spacing along their route.
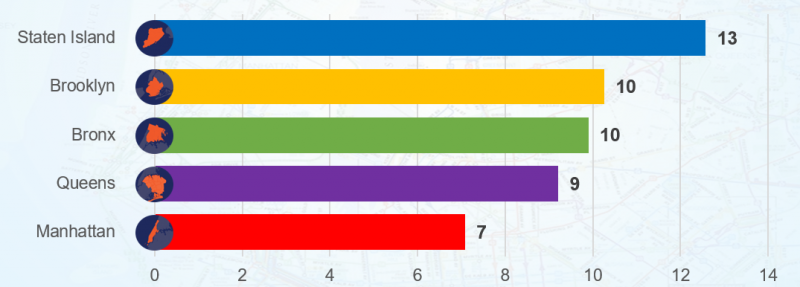
Across the NYCT system, nearly a quarter of buses do not provide steady service during the weekday. Approximately 24 percent of Brooklyn and Manhattan local buses, 23 percent of Bronx buses, 21 percent of Queens buses, 19 percent of Staten Island buses, and 18 percent of inter-borough express buses fail to maintain scheduled spacing during the day (see Chart 12).
Meanwhile, SBS routes fail to maintain consistent spacing 19 percent of the time, even though they enjoy a number of speed and reliability enhancements—like dedicated bus lanes and off-board fare collection—that should ensure greater dependability.[xliii]
Chart 12: Percentage of NYCT buses arriving off-schedule, 2017YTD

MTA “Transit & Bus Committee Meeting.” March 2017 to October 2017.
Speed
Traffic congestion, red lights, delivery trucks parked at bus stops, a succession of left- and right-turns along meandering routes. For bus drivers, navigating New York City streets is not easy. Little wonder that bus speeds are so slow.
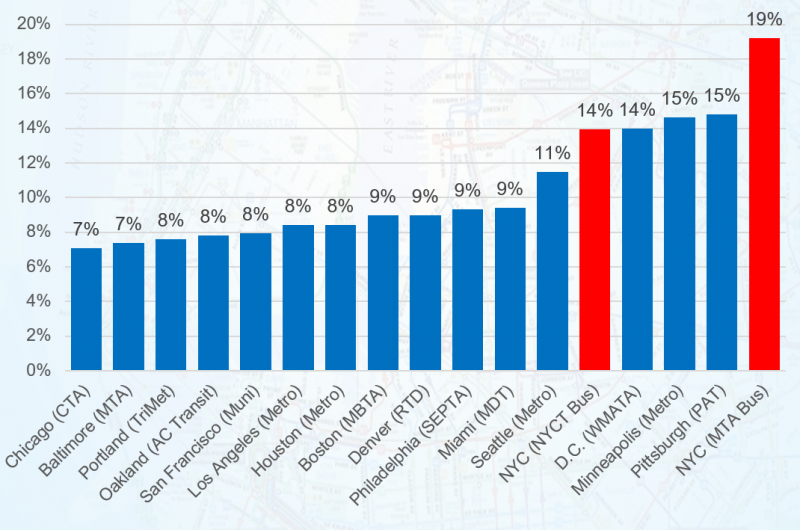
The average New York City Transit bus travels a dismal 7.4 miles per hour along its local, SBS, and express routes – slowest among the seventeen largest bus companies in the nation (see Chart 13). The MTA Bus Company—which specializes in limited-stop, express service—performs little better, traveling 8.4 mph and ranking third-to-last among its peers.[xliv]
Chart 13: Seventeen largest urban bus companies, average speed
National Transit Database, “Service,” Federal Transit Administration. 2016.
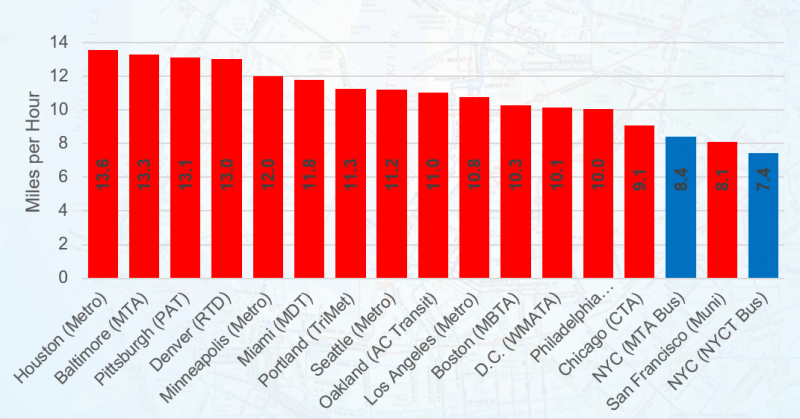
While a number of variables affect bus speeds, one powerful factor is population density— which is often accompanied by a density of cars, delivery trucks, pedestrians, and traffic lights. Of the four cities where average bus speeds are lower than 10 miles per hour—San Francisco, Chicago, Philadelphia, and New York—all are among the densest in the country.
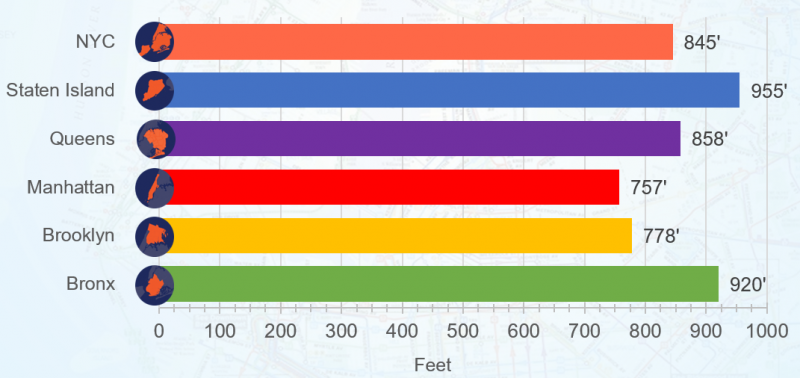
These dynamics are played out within New York City as well (see Chart 14). Average bus speeds vary dramatically among the boroughs, with the slowest average speeds in Manhattan (5.5mph), Brooklyn (6.3mph), and the Bronx (6.5mph). This is significantly lower than local routes in Queens (8.1mph) and Staten Island (11.4mph).
Chart 14: Average bus speed, by borough
Freeman, Neil. “NYC Bus Performance API.”
Throughout the city, there are 17 bus routes that travel slower than five miles per hour, on average. Sixteen of them are in Manhattan, including two Select Bus Service routes, the M34 and M34A (see Table 3). On the other end of the spectrum, only eleven routes have average speeds in excess of twelve miles per hour. All but three are in Staten Island.
Table 3: The slowest bus routes in NYC
| Bus | Average Speed (mph) | Bus | Average Speed (mph) |
| M42 | 3.90 | M34A SBS | 4.67 |
| M31 | 4.14 | M14D | 4.74 |
| M57 | 4.17 | M34 SBS | 4.78 |
| M66 | 4.25 | M96 | 4.78 |
| M50 | 4.51 | M79 | 4.90 |
| M116 | 4.51 | M102 | 4.93 |
| M22 | 4.53 | M103 | 4.93 |
| M14A | 4.58 | M8 | 4.96 |
| B12 | 4.65 |
Freeman, Neil. “NYC Bus Performance API.”
These sluggish speeds do little to attract or retain ridership in New York City. Taking the bus can be an infuriating experience—inching through traffic, waiting at an endless stream of red lights, watching the bus be overtaken by pedestrians and bicycles.
And while the city’s density and congestion are deeply intertwined with these outcomes, slow and unreliable bus service is far from inevitable. As the following section will demonstrate, poor performance is tightly linked to design, planning, and investment decisions, not an unavoidable and unique facet of life in New York City.
Making the Bus System Better
The typical New York City bus trip is long and complex and can be doomed by a number of factors, contributing to both slow speeds and delays.
Did the bus exit the depot on-time? Does it travel through congested streets? How many traffic lights are located on the route and how often is the bus caught at a red light? How many bus stops are along the route and how much time is spent entering, off-boarding, on-boarding, and exiting at these stops? How many turns are positioned along the route, requiring the driver to carefully rotate a multi-ton vehicle amidst cars, pedestrians, cyclists, and other encumbrances? Are cars or delivery vehicles illegally parked along its route, blocking the bus lane or individuals stops? How effectively does it connect with other, faster bus and subway lines, so that passengers can minimize their commute times?
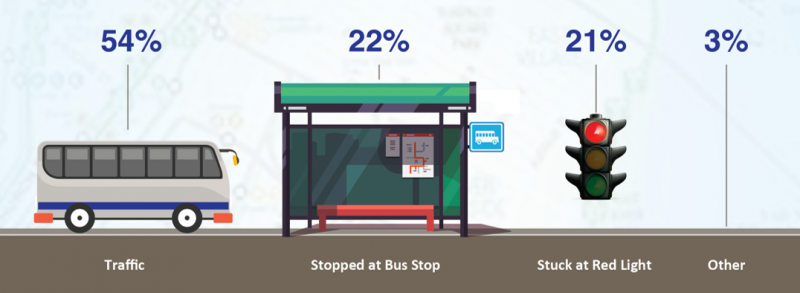
New York City buses spend only half their time in-motion/in-traffic. Another 21 percent is spent at red lights and 22 percent at bus stops (see Chart 15).[xlv] Helping the bus move faster, then, has little to do with increasing top speeds.
Chart 15: How a bus spends its time
New York City DOT and MTA. “Introduction to Bus Rapid Transit Phase II.”
Instead, it requires less congestion, through measures like dedicated bus lanes. It requires Transit Signal Priority to reduce the time at red lights. It requires shortening the time spent at stops by upgrading fare payment systems, curbs, and shelters to speed up exit and entry. It requires the ticketing of cars and delivery trucks that obstruct stops and bus lanes. And it requires limiting the number of bus stops so that less time is spent decelerating into a stop, accelerating back into crowded traffic, and boarding and un-boarding passengers.
Fortunately, efforts to improve bus speed and reliability also save money and allow for a more efficient allocation of resources. For instance, if a bus averages 6 miles per hour over a 6 mile route, it can complete the route in both directions every two hours and cover the circuit four times over an eight hour stretch. But if the average speed is bumped up to 9 miles per hour, a circuit can be completed in an hour and twenty minutes and six times over an eight hour period. Scheduled frequencies could then be increased by a third with the same number of buses.
Transit Signal Priority
There are over 12,000 traffic signals positioned throughout the five boroughs.[xlvi] These signals are essential for governing the city’s intersections; helping millions of cars, trucks, bicycles, and pedestrians move faster and more efficiently. They do, however, require vehicles to devote a significant amount of time waiting for the light. For the typical New York City bus, for instance, over 20 percent of its trip is spent waiting for lights to turn green.[xlvii]
There is, however, a better way. Buses can be granted priority at traffic lights, with signals dynamically adjusting to extend a green or shorten a red light at the approaching intersection. This is known as “Transit Signal Priority” (TSP) and, after years of false starts, it is slowly being implemented on New York City streets.
New York City first piloted TSP on Victory Boulevard in 2006. With a high volume of bus routes traveling along Victory en route to the St. George Ferry Terminal, it was an ideal location to test the technology and speed up trips for thousands of riders. Modems and transponders were installed on several buses, allowing them to communicate with traffic lights and improve bus flow.
The pilot study, unfortunately, did not go as planned. Buses with transponders were suddenly relocated to Brooklyn or Queens depots without explanation, leaving planners scrambling to replace them. Budgeters and administrators, meanwhile, began to lose interest in the technology when it appeared TSP could speed up bus trips, but not necessarily save the agency money. Still others felt little ownership over the initiative, uninterested in implementing TSP because it had already been done in other cities or because it was first spearheaded by the City DOT.[xlviii]
Over a decade later, TSP is active at a meager 260 intersections along only five of the city’s 326 bus routes.[xlix] This is far lower than London, where it has been installed at 3,200 intersections, Los Angeles, where it is active at 654, or Brussels, Dublin, Barcelona, Seattle, Montreal, Sydney, and Zurich, were a much higher percentage of traffic signals are equipped.[l]
And while TSP has proven to be highly effective in New York City—increasing bus speeds by an impressive 18 percent along its five corridors—plans for future rollout remain tepid. According to a recent report by the City DOT, the agency is hoping to add 886 intersections and 15 routes by the end of 2020.[li] This would leave New York City three years and two-thirds behind London’s current progress.
London TSP is not just expansive, however, it is also more technologically advanced. Its Split Cycle Offset Optimization Technique balances bus priority with the movement of other vehicles, ensuring that TSP is not disruptive to general traffic. It also has the capability to identify late buses and provide them with more optimal signal priority. New York City has long considered a similar upgrade, but has yet to implement it.
Recommendation 5: NYC DOT and MTA should improve coordination and expedite the implementation of Transit Signal Priority along bus routes |
| Over a dozen years ago, the city invested millions of dollars to modernize its traffic signals, outfitting them with the technology to prioritize buses and speed them on their way. Unfortunately, the MTA took years to install the corresponding transmitters on their vehicles and when they finally did, implementation was slow and haphazard. It remains a largely untapped technology that could be improving bus speeds, if not for the failure of two large bureaucracies to work together.
The MTA and City DOT must expedite TSP implementation and, more broadly, dramatically improve their working relationship. Ten years ago, the introduction of Select Bus Service inaugurated what appeared to be an era of close collaboration between the two agencies. Those relations have since been frayed. Quality bus service is impossible without the focused and collaborative efforts of both agencies. When the State, City, and transit authorities fail to work together, bus riders (and all New Yorkers) suffer. |
Recommendation 6: DOT and MTA should increase computer engineering capacity to help expedite TSP implementation and to improve bus dispatch |
| To improve bus performance, the City and MTA should enhance its computer engineering capacity and introduce more automation to its operations. Leveraging algorithms and machine learning can enhance the work of existing staff, expedite the implementation of TSP, and dramatically improve dispatch so that buses are less prone to bunching along their routes and can better adhere to their schedules.
The implementation of TSP is more complicated on some routes than others—particularly high-volume roads where traffic lights are precisely timed. But with the help of technology, staff at the DOT Traffic Management Center can make more timely decisions about how (or whether) to prioritize lights for buses, while minimizing the impact on other vehicles (and other buses). Meanwhile, to improve the regularity and reliability of buses, the MTA should better leverage computer technologies at their Bus Command Center and increase dispatch staffing. At the moment, MTA dispatchers are overstretched. In addition to their core duties of monitoring the location and schedule of buses in the field, they are responsible for intervening in cases of accidents and emergencies. To assist dispatchers, a system of automatic alerts should be developed and sent to bus drivers when they are running off schedule or bunched with other buses along their route. Basic commands can also be programmed, advising drivers to alter their speeds, skip or hold at stops, or other timely instructions. This can be implemented in conjunction with the launch of the East New York Bus Command Center. |
Bus Stop Balancing
Bus stops should be positioned at regular intervals to ensure they are accessible to all riders. This is especially true for older riders and those with disabilities, for whom the bus is often the only accessible mode of public transportation. As such, any discussion of modifying bus stops must be undertaken with input from these affected communities, with an eye toward increasing service and efficiency for all.
Standards for spacing vary across the globe. The European HiTrans guides, for instance, recommend .4 miles (~2,100 feet) between bus stops on local city routes.[lii] By contrast, the MTA Bus Company maintains a “minimum desired spacing interval of approximately 750 feet” for its local buses.[liii]
There are several routes, however, that far exceed this “desired spacing interval,” forcing riders to travel longer than recommended to their stop and creating a burden for those with limited mobility. On ten routes, for instance, bus stops are spaced more than 1,200 feet apart, on average (see Table 4). While several of these lines travel over a bridge or through less congested areas of the city, others traverse dense neighborhoods and may not be sufficiently accessible to their riders.
Table 4: Local routes with the longest average distance between stops
| Bus Route | Average distance between stops (feet) | Bus Route | Average distance between stops (feet) |
| S56 | 1,259 | M35 | 1,485 |
| Q10 | 1,362 | BX23 | 1,533 |
| BX12 | 1,396 | Q35 | 1,641 |
| BX29 | 1,449 | Q100 | 3,560 |
| S55 | 1,455 | B39 | 3,858 |
NYCT Bus and MTA Bus Company. “Static Data Feeds: General Transit Feed Specification,” MTA. January 2017.
On the other side of the spectrum, 66 of the MTA’s 220 local bus routes—or 30 percent—do not maintain the minimum stop-spacing standard recommended by the Authority’s guidelines. In fact, among Manhattan bus routes, the average distance between bus stops is 757 feet, barely higher than the recommended minimum (see Chart 16).[liv] Average stop-spacing in Brooklyn (778 feet) is only slightly higher— demonstrating that slow bus speeds in these two boroughs are not simply a product of congestion, but also linked to deliberate decisions by MTA planners to bunch stops along these routes.
Chart 16: Average distance between local bus stops, by borough
NYCT Bus and MTA Bus Company. “Static Data Feeds: General Transit Feed Specification,” MTA. January 2017.
Shorter distances between stops may well be appropriate in certain sections of the city, like those with a high concentration of seniors. Yet the fact remains that bunched stops lead to slow and unreliable service that repels all bus riders, both young and old. Across the city, there are nine bus routes with stops located less than 650 feet apart. Four are in Brooklyn, three are in Manhattan, and two are in Queens (see Table 5). All but two saw ridership fall between 2011 and 2016 and collectively, they experienced a nine percent drop, more than double the city-wide average.[lv]
Table 5: Local routes with the shortest average distance between stops
| Route | Average distance between stops (feet) | Average Speed | Ridership Change, 2011-2016 |
| M8 | 556 | 5.0 | -11% |
| M10 | 599 | 5.8 | -17% |
| B74 | 611 | 7.5 | -3% |
| B14 | 620 | 5.4 | -4% |
| Q56 | 621 | 6.0 | -15% |
| B60 | 623 | 5.8 | -17% |
| Q49 | 629 | 5.7 | 9% |
| B3 | 640 | 6.4 | -9% |
| M21 | 642 | 5.0 | 12% |
NYCT Bus and MTA Bus Company. “Static Data Feeds: General Transit Feed Specification,” MTA. January 2017.
Recommendation 7: The MTA should review and improve stop-spacing on all of its routes and revisit its stop-spacing guidelines |
||||||||||||||||||||||||||||||
| In collaboration with impacted neighborhoods, the MTA should conduct a top-to-bottom review of stop-spacing on all of its bus routes. Spacing should be right-sized so that routes can better balance the need for a fast, reliable, and accessible system. This review should begin with the 29 bus routes where average stop-spacing exceeds 1,000 feet and the 66 routes where average spacing is less than 750 feet, the MTA’s minimum standard.
More broadly, the MTA should revisit its stop-spacing guidelines. Its current “minimum desired spacing interval” of 750 feet is far shorter than international and domestic peers (see Table 6). Washington DC, Philadelphia, and San Francisco have all increased their stop-spacing standards in recent years. Table 6: Stop-spacing standards in North American cities
|
Recommendation 8: The MTA should reduce the time spent at bus stops by introducing all-door boarding and tap-and-go fare payment |
| In addition to reviewing the number of bus stops, the City and MTA should work to reduce the time spent at bus stops. This can be achieved through several methods.
As the MTA rolls out its modern fare card system, it should allow all-door boarding and tap-and-go fare collection on-board. All door boarding allows passengers to enter the bus at both the front and center entrances, speeding the boarding process. Tap-and-go fare collection, meanwhile, accomplishes the same goal by offering faster, more plentiful options for payment. Fare payment machines can be placed either at the entrances or situated within the bus, as is the case in some European cities. The latter option would reduce conflict and collisions between those exiting and entering the bus. The City, meanwhile, must crack down on illegal parking and idling at bus stops. Too often, cars and trucks are situated too close to a stop, blocking entry or exit. This forces bus drivers to pull in at odd angles, making it difficult to board and un-board passengers and impossible to safely deploy a wheel chair ramp. To avoid these issues, more traffic officers and traffic cameras should be deployed in service of the bus system. |
Recommendation 9: To reduce time spent at bus stops, the City should adopt the Fair Fares plan and assist unbanked riders |
| Along many New York City bus routes, more than 15 percent of riders do not use Metrocards.[lxiv] Instead, these straphangers pay their fares one coin at a time—paper money is not accepted on buses—a slow process that significantly increases boarding times.
Several of these routes travel through neighborhoods with a high share of lower-income and unbanked residents. Helping these riders gain access to Metrocards, then, will not only improve their financial prospects, but also speed up their bus service. To do so, the City should adopt the Fair Fares plan, providing half-price Metrocards to New Yorkers below the poverty line. Additionally, the Office of Financial Empowerment should team up with New York City Transit to provide bus riders with financial counseling, access to mainstream banking, and assistance with benefits enrollment. |
Long and Winding Bus Routes
In Budapest, the typical bus route does not exceed 25 minutes from end-to-end. There is a clear logic to this policy: the longer the route, the greater likelihood for delays to accumulate and cascade down the entirety of the line.
New York City buses do not follow this standard. Routes can span nearly two hours and travel well over ten miles. In fact, the average local route in Staten Island is 10.6 miles and the average citywide is 6.8 miles. Of the ten longest routes in the city (see Table 7), four are in Staten Island and three are in Brooklyn.
Table 7: The ten longest local bus routes
| Name of Route | Length of Route (miles) |
Name of Route | Length of Route (miles) |
| S78 | 20.8 | B6 | 12.6 |
| S74 | 19.4 | M4 | 12.1 |
| S59 | 16.0 | M101 | 11.9 |
| B15 | 13.3 | Q27 | 11.9 |
| B82 | 12.8 | S54 | 11.5 |
NYCT Bus and MTA Bus Company. “Static Data Feeds: General Transit Feed Specification,” MTA. January 2017.
These ten routes are not only long, they are also meandering, averaging 13 turns each. Frequent turns along a route will slow down a bus, forcing it to wait for an opening in traffic and carefully maneuver onto a new road. This can be dangerous, as turns carry a higher likelihood for collisions.
Most importantly, turns are indicative of indirect, slow routes that are riddled with detours. On dozens of the city’s routes—particularly in Staten Island, Queens, and Brooklyn—buses will intermittently exit a major road to do a quick loop around local streets. This can be infuriating for riders, who wish to get to their final destination as quickly and directly as possible.
The MTA has, in fact, acknowledged the efficacy of straighter routes, stating that “bus service is more reliable when operated in a straight line than when many turns exist along the route.”[lxv] Unfortunately, they too rarely follows their own dictum.
Chart 17: Average number of turns along local bus routes, by borough
MTA Bus Timetables.
Among the city’s 220 local routes, 38 feature at least 15 turns and 97 have ten or more.[lxvi] The average Staten Island route involves 13 turns (see Chart 17) while the average Manhattan line has seven—a high number, given that Manhattan’s street grid lends itself to straight routes.
Table 8: Bus routes featuring over 20 Turns
| Bus Route | # of Turns | Bus Route | # of Turns |
| BX8 | 29 | B67 | 22 |
| S57 | 28 | B69 | 22 |
| Q39 | 27 | B62 | 21 |
| Q102 | 26 | BX30 | 21 |
| S52 | 26 | Q38 | 21 |
| B13 | 25 | Q37 | 20 |
| BX23 | 23 | Q67 | 20 |
| Q47 | 23 |
MTA Bus Timetables.
Fifteen of the city’s bus routes feature at least 20 turns (see Table 8), with the BX8, S57, Q39, S52, and B13 among the most convoluted (see below). These routes include detours into various neighborhoods, plazas, and mail facilities, at times turning into a long driveway and circling back. For those passengers riding to the terminal or another destination farther along the route, such detours can be reason enough to avoid the bus.
Graphic 1: The most circuitous routes in NYC
MTA Bus Timetables.
Recommendation 10: The MTA should adopt a more rapid, direct, and grid-like bus network and incorporate these design principles into its service standards |
||||
| Much of the New York City bus system is designed under the premise that riders refuse to transfer. To accommodate this assumption, routes generally have a hub and spoke design—radiating out from a central destination and meandering along their route to service multiple neighborhoods.
Yet a number of internal studies have demonstrated that riders are willing to transfer, provided it speeds up their commute. A Northeast Queens bus study, for instance, found that approximately one-third of riders transfer to another bus and one-third switch to the subway. A study of Staten Island express buses, meanwhile, found that many riders will exit as soon as they enter Manhattan and transfer to the subway. This revelation should guide MTA bus planners moving forward, allowing them to design a shorter, straighter, faster, and more grid-like network. Currently, major thoroughfares throughout the city—like Victory Boulevard, Hillside Avenue, Fordham Road, and Fifth Avenue—carry multiple bus routes as they approach a central destination. These bus lines will have converged after servicing local streets in various neighborhoods. Instead, the MTA should divide long, meandering routes in half. Rather than turning onto major thoroughfares, they should cross or terminate at these heavy roads (see below). Riders could then transfer to an ultra-high frequency route (~1-2 minute headways) that travels exclusively on that road. This will shorten the length of routes, cut down on the number of turns, and create a more direct, legible, faster, and reliable bus system.
In Chicago, these design principles are embedded into the Transit Authority’s official “Service Standards and Policies.” The CTA discourages a “duplication of service,” stating that “it is the Authority’s policy to operate only one local bus route on a major arterial street.”[lxvii] The MTA should adopt a similar guideline. |
Bus Lanes
Exclusive bus lanes dramatically improve speed and reliability. This is particularly true in New York, where the opportunity to bypass highly congested roads can have a major impact.
While dedicated bus lanes are often associated with Select Bus Service, there are also a number of restricted, rush hour lanes located throughout the city. They are primarily found on major roads in the Midtown and Downtown CBDs, as well as thoroughfares, expressways, tunnels, and bridges outside of Manhattan.[lxviii]
In total, there are 104 bus lane miles along the City’s 6,000 miles of roadway.[lxix] This is far lower than the share of bus lanes in major cities like Brussels, Barcelona, Dublin, Seattle, Singapore, and Lisbon.[lxx]
The siting and implementation of restricted bus lanes is a complicated task with numerous trade-offs. Because an exclusive lane for a bus generally leaves one less lane for private vehicles, it is important to determine whether existing (and latent) ridership merits such an intervention.
One helpful, albeit imperfect, method for determining the efficacy of a bus lane is to evaluate the frequency of buses along that road. There are, in fact, sections of the city that handle an extraordinary volume of buses during the morning rush hour—and throughout the day—and can benefit from exclusive lanes.
Of the more than 15,000 bus stops throughout the five boroughs, 156 service more than 45 buses per hour during the morning peak and 102 are used by eight or more routes.[lxxi] To the NYC DOT’s credit, the vast majority of these bus stops are situated along an exclusive bus lane, though not all. Among those that are neglected, most would be covered by simply extending existing bus lanes by a few blocks.
Beyond location, a number of factors will influence a bus lane’s impact on speed and reliability. Is it fully separated, allowing buses to bypass traffic lights along their route? Is it well maintained, so that markings and signage are clear? Is it protected—via bollard, curb, median, or an elevated road surface—from interference from cars and trucks, preventing them from illegally parking, idling, or traveling in the lane? Is their sufficient enforcement—via police or traffic cameras—to thwart such encroachments?
In New York City, this enforcement is often wanting. An internal MTA study of the Livingston Street bus lane, for instance, found not a single bus traveled the length of the street without having to merge out of the lane due to an obstruction. Not only do these obstructions reduce the utility of bus lanes, the constant exiting and entering into general traffic is actively dangerous for adjacent cars, bike riders, and pedestrians.
Recommendation 11: The City should improve the maintenance, design, and enforcement of bus lanes |
| To maximize the utility of bus lanes and improve bus speeds and reliability, the City should implement a number of maintenance, design, and enforcement measures.
First, maintenance should be improved. All bus lanes, whether SBS or not, should be marked distinctly and repainted more regularly so that they do not become faded. Second, the DOT should continue to experiment with greater separation of bus lanes to physically restrict other vehicles from entering the lane. They should also build more lanes in the center of the road—as featured on a small portion of the new SBS Bx6 and the upcoming Woodhaven line—which are less prone to obstructions from idling vehicles and often preferred over losing a row of parking. Not only should these median bus lanes serve as a model going forward, existing curb-side and off-set bus lanes should be converted, where feasible. The City should also expand the number of double bus lanes—like those currently proposed on Fifth Avenue—to better accommodate turns and help mitigate bunching by enabling buses to go around those waiting at a stop. Finally, the City must improve the enforcement of its bus lanes. This will require a more aggressive police presence in the vicinity of bus lanes and state legislation to expand the use of camera enforcement. A 2015 state law allows camera enforcement along 16 routes between 7am and 7pm.[lxxii] The legislature should dramatically increase (or eliminate) this cap on routes and hours of operation. The City Department of Finance, meanwhile, should amend its NYC Delivery Solutions and Commercial Abatement programs, which offer reduced fine schedules on parking violations.[lxxiii] Any violations that take place in a bus lane should not be eligible for reductions. |
Recommendation 12: The NYC DOT should place greater emphasis on bus lanes outside of SBS corridors. It can also assist with the introduction of new, inter-borough routes by installing exclusive lanes on more city bridges |
| From Hillside Avenue to Victory Boulevard, Lexington Avenue to Fordham Road, there are a number of shorter bus lanes that are exclusive during rush hour. These lanes are crucial for managing circulation in the city’s most congested areas and should be more integral to the City’s strategy for upgrading bus service.
A number of these bus lanes—along Fifth, Madison, Church, and Victory, for instance—could be extended several blocks to better serve buses in high traffic areas. New lanes on Bay Street in Staten Island and Main Street in Queens should also be considered. Meanwhile, exclusive lanes on Manhattan-Bronx and Queens-Brooklyn bridges would be particularly useful for the expansion of inter-borough bus service. The City’s current efforts to build a double bus lane on Fifth Avenue and keep it exclusive for 24 hours is commendable and should serve as a model going forward. Expanding, extending, and better enforcing these non-SBS bus lanes will improve local and express routes throughout the city. |
Interconnectivity with the Subway System
Effective bus and subway routes will complement and reinforce one another. Buses should extend and connect the subway system, maximizing coverage and minimizing commute times.
This interconnectivity is evident in neighborhoods like Jamaica and Flushing and along Utica Avenue. These routes operate as extensions of subway lines, assisting New Yorkers in neighborhoods underserved or unserved by the subway system.
Many bus routes, however, have too few or too many connection points with the subway. The former leaves little opportunity for transfers, the latter is often redundant service with resources that could be used more effectively elsewhere.
Among the city’s 223 non-Express and non-Staten Island bus routes, 75 stop within .1 miles of two or fewer subway stations. While many of these are outer-Queens or outer-Brooklyn lines that deliberately terminate at a single subway station to allow for transfers, several run near subway lines and could simply be tweaked to move the route closer to a subway station and allow for easier transfers.
On the other hand, 13 bus routes have more than 20 stops located within 0.1 miles of a subway station. Most run directly above or below a subway line for a substantial section of their route. While some of these routes provide essential service for mobility impaired populations, many are duplicative, unpopular, and should be reconsidered. Collectively, these routes shed 35,876 riders from 2011 to 2016, a 20 percent drop (see Table 9).
Table 9: Bus and subway overlap
| Route | Bus Stops within .1 Miles of A Subway Station | Ridership 2011 | Ridership 2016 | Change |
| M7 | 28 | 16,557 | 12,905 | -22% |
| M20 | 27 | 4,113 | 2,446 | -41% |
| M104 | 27 | 12,626 | 8,223 | -35% |
| M102 | 26 | 15,917 | 12,292 | -23% |
| M101 | 25 | 29,635 | 24,275 | -18% |
| M3 | 24 | 15,433 | 13,149 | -15% |
| B25 | 23 | 11,205 | 10,048 | -10% |
| M103 | 23 | 12,911 | 9,786 | -24% |
| Q32 | 23 | 12,271 | 9,454 | -23% |
| M4 | 21 | 20,443 | 16,235 | -21% |
| Q56 | 21 | 9,267 | 7,862 | -15% |
| Q60 | 20 | 14,525 | 13,761 | -5% |
| M10 | 20 | 8,283 | 6,874 | -17% |
| Subtotal | 183,186 | 147,310 | -20% | |
Overlap: NYCT Bus and MTA Bus Company. “Static Data Feeds: General Transit Feed Specification.”
Ridership: “Average Weekday Ridership” MTA New York City Transit and MTA Bus Company.
Improving SBS
Bus Rapid Transit was first introduced in Curitiba, Brazil in 1974. Its express intention was to increase the speed, reliability, and capacity of bus service through a number of core enhancements. These included dedicated bus lanes, off-board fare collection, limited stop-spacing, and Transit Signal Priority.
In New York City, the introduction of a bus rapid transit route requires close collaboration between the MTA and City DOT. Designing bus lanes, penalizing private vehicles who encroach on these lanes, installing fare collection machines, building curb extensions to expedite boarding, implementing TSP on traffic lights along the route: each of these measures has to be initiated by the City DOT.
It is little surprise, then, that the process of converting a local route to a bus rapid route is typically inaugurated by the City. In the lead-up to a new line, the DOT will hold numerous meetings with local electeds, community boards, and neighborhood residents to discuss the benefits of SBS and the range of possible interventions.
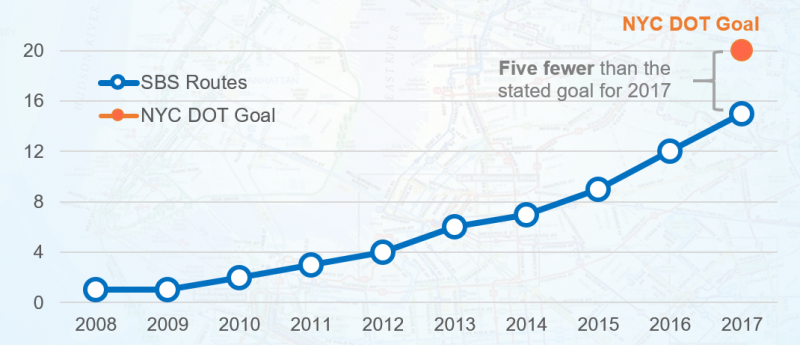
The first rapid transit—or “Select Bus Service”—line arrived in New York City in 2008. Today, there are fifteen SBS routes throughout the five boroughs, with one currently in development. During his first term in office, Mayor de Blasio helped introduce nine of these lines—five fewer than the stated goal at the beginning of his Administration (see Chart 18).[lxxiv]
Chart 18: The number of SBS Routes, by year
NYC DOT. “Select Bus Service Routes.”
Over the last decade, the SBS program has enjoyed a number of key achievements and introduced effective, replicable innovations that should be extended to local routes more broadly. Unfortunately, implementation has been spotty, with many of its routes suffering from half-measures and design flaws. As a consequence, SBS has failed to deliver on its core goal: increase bus ridership.
Of the nine routes introduced prior to 2016, five experienced a ridership decline in comparison to the year prior to implementation (when it existed as a local and/or limited route). Overall, ridership declined by 0.2% on these nine lines; better than the system as a whole, but still a disappointment (see Table 10).
Table 10: SBS ridership
| Route | Year Launched | Ridership the Year Prior to Launch | 2016 Ridership | Ridership Change |
| M34/M34A | 2011 | 18,092 | 14,901 | -18% |
| M15 | 2010 | 53,073 | 44,797 | -16% |
| B44 | 2013 | 39,661 | 37,418 | -6% |
| M60 | 2014 | 17,013 | 16,751 | -2% |
| Q44 | 2015 | 28,139 | 27,712 | -2% |
| M86 | 2015 | 23,846 | 24,746 | 4% |
| Bx12 | 2008 | 42,219 | 48,124 | 14% |
| Bx41 | 2013 | 18,947 | 23,558 | 24% |
| S79 | 2012 | 8,969 | 11,378 | 27% |
| Total | 249,959 | 249,385 | -0.2% |
Post-2011: “Average Weekday Ridership” MTA New York City Transit and MTA Bus Company.
Pre-2011: NYCDOT and MTA. “Select Bus Service: Background and Context,” NYU Rudin Center. April, 2013.
These underwhelming ridership figures can be explained, in part, by the speed, frequency, and reliability of SBS routes—where they have only minimally outperformed their local peers.
In its peak direction, for instance, SBS buses arrive every 4.9 minutes during morning rush hour. The average local route? Every 6.7 minutes. SBS routes travel at an average speed of 8.7 miles per hour. Local routes? Seven miles per hour. Clearly, SBS is superior, but not overwhelmingly so (see Table 11).[lxxv]
Table 11: Frequency and speed of SBS buses
| SBS Route | Rush Hour Frequency in Peak Direction (minutes) | Average Speed (mph) |
| B46+ | 2.3 | – |
| M15+ | 2.9 | 7.1 |
| BX12+ | 4.0 | 9.5 |
| M86+ | 4.0 | 5.1 |
| M79+ | 4.3 | – |
| Q44+ | 4.6 | 8.7 |
| S79+ | 5.0 | 14.3 |
| B44+ | 5.5 | 8.6 |
| BX41+ | 6.7 | 8.6 |
| M23+ | 7.5 | – |
| M60+ | 7.5 | 8.7 |
| M34+ | 8.6 | 4.8 |
| M34A+ | 8.6 | 4.7 |
| Q70+ | 10.0 | – |
| SBS Average | 4.9 | 8.7 |
| Local Route Average | 6.7 | 7.0 |
Frequency: NYCT Bus and MTA Bus Company. “Static Data Feeds: General Transit Feed Specification.” Speed: Freeman, Neil. “NYC Bus Performance API.”
Bus reliability follows a similar pattern, with Select Bus only slightly outperforming local lines (see Chart 19). City-wide, SBS routes fail to maintain consistent gaps between buses 19 percent of the time while local buses fail 22 percent of the time.
Chart 19: Wait time assessment of local and SBS buses, 2017 YTD

MTA “Transit & Bus Committee Meeting.” March 2017 to November 2017.
The passable, though not altogether superlative performance of SBS is largely driven by a failure to uphold its own design standards. For instance, the MTA aims to locate SBS bus stops a half-mile (or 2,640 feet) apart, reducing stop time.[lxxvi] This standard is sustained, however, on only four of the 14 SBS routes while five—the M34, M79, M23, M86, and M34A—maintain stop-spacing of less than 1,000 feet (see Table 12). As a consequence, these buses are forced to expend much of their time pulling in and out of stops and on-boarding and off-boarding passengers.
Meanwhile, the average SBS route is 6.8 miles, identical to the average local route, and includes seven turns. These long, winding routes introduce countless obstacles and allow for mishaps to cascade down the line, reducing reliability.
Table 12: Length, stop-spacing, and number of turns on SBS routes
| Route | Borough | Length of Route (miles) | Average Distance Between Stops (feet) |
Number of Turns | ||
| M34 | Manhattan | 2.1 | 884 | 7 | ||
| M79 | Manhattan | 2.2 | 907 | 4 | ||
| M23 | Manhattan | 2.6 | 918 | 5 | ||
| M86 | Manhattan | 2.4 | 922 | 4 | ||
| M34A | Manhattan | 2.5 | 974 | 2 | ||
| M15 | Manhattan | 8.7 | 2,252 | 6 | ||
| M60 | Manhattan | 9.4 | 2,262 | 10 | ||
| Q44 | Queens | 14.0 | 2,351 | 15 | ||
| B46 | Brooklyn | 6.0 | 2,547 | 3 | ||
| BX41 | Bronx | 5.4 | 2,589 | 1 | ||
| BX12 | Bronx | 7.6 | 2,664 | 12 | ||
| B44 | Brooklyn | 9.4 | 2,744 | 5 | ||
| S79 | Staten Island | 15.1 | 3,624 | 11 | ||
| Q70 | Queens | 8.8 | 7,708 | 6 | ||
| SBS Average | 6.8 | 2,174 | 7 | |||
| Local Route Average | 6.8 | 845 | 10 | |||
Stop-spacing: NYCT Bus and MTA Bus Company. “Static Data Feeds: General Transit Feed Specification.” Turns: MTA Bus Timetables.
Recommendation 13: To improve SBS performance and increase ridership, the MTA should better adhere to its SBS design standards. The City DOT, meanwhile, must enhance bus lane design and enforcement |
| To improve the speed and reliability of SBS buses, the MTA should look to right-size stop-spacing along its routes and, where possible, shorten routes and eliminate unnecessary turns. Meanwhile, the City DOT should continue to introduce truly separated bus lanes to ensure they are protected from unauthorized cars and trucks. It should also work to provide exclusive lanes throughout the entirety of the route, not just segments. |
Capital Costs and Maintenance
Each day, over 5,700 MTA buses circulate through the city.[lxxvii] These buses are subject to significant wear and tear—constantly stopping, starting, and weaving through traffic, potholes, turns, lights, and bus stops. To withstand these conditions and maintain high-quality service, city buses receive regular tune-ups at the MTA’s 29 depots and should be placed on a regular replacement cycle.
The condition of New York City buses has improved markedly in the last half dozen years. From 2011 to 2017, the incidence of mechanical failure—or “mean distance between failure”—jumped from 3,140 miles to 6,748 miles, a 115 percent improvement. This can largely be credited to capital investments. In 2011, the average bus was 8.4 years old and 33 percent were twelve years or older – the recommended “useful life” of a city bus. Today, those figures are 7.8 years and 22 percent, respectively (see Table 13).
Table 13: Bus fleet
| Bus Fleet | 2011 | 2017 |
| Bus Mean Distance Between Failure | 3,140 | 6,748 |
| Average Age of Bus | 8.4 | 7.8 |
| Share of Buses 12 Years or Older | 33% | 22% |
MTA “Transit & Bus Committee Meeting.” November 2011 to November 2017.
But while the MTA has clearly made progress, there is a long way to go. With its twelve-year replacement cycle, the average MTA bus should be six years old and zero percent should be running after a dozen years, not 7.8 years and 22 percent.
Keeping these old buses running is a costly proposition. Conditions on New York City roads can be punishing, quickly destroying a vehicle’s brakes and transmissions and necessitating constant monitoring and replacement.
Moreover, older vehicles do not perform well in the field. In 2012, the MTA found that buses that were less than three years old had a Mean Distance between Failure of 8,824 miles. This vastly outperformed buses a dozen years or older, which broke down every 3,108 miles.[lxxviii]
Not only are MTA buses old and under-performing, they are also purchased on an irregular schedule. Given the 12 year useful life of city buses, 1/12th of the fleet should be replaced each year. This has not been the case.
The age of the MTA bus fleet is highly variable. A large number of buses were purchased in 2009, 2012, and 2015 while very few were procured in 2010, 2013, and 2014—hardly a “regular” replacement cycle (see Chart 20).[lxxix]
Chart 20: Number and age of MTA buses
National Transit Database. “Revenue Vehicle Inventory: Active Fleet Vehicles,” 2016.
This patchy schedule has serious ramifications for the MTA budget. When a bus company’s procurement is not smooth, its maintenance costs become similarly lumpy, as a big bump in bus purchases in one year leads to a big bump in transmission replacements a few years out. Moreover, maintaining a regular replacement schedule would better position the MTA to purchase buses through their operating budget (or to “pay as you go”) rather than the capital budget.
Recommendation 14: The MTA should maintain a regular replacement cycle for its buses |
| Despite notable progress over the last decade, the MTA bus fleet is still much too old. Moving forward, it should be placed on a regular procurement cycle, replacing 1/12th of the fleet each year.[lxxx] This will smooth procurement and maintenance costs and improve the performance of buses in the field.
Moreover, a regular replacement cycle will make it easier for the Authority to purchase new buses via the operating budget. Covering the depreciation of assets through the operating budget is a responsible accounting practice and will help the MTA reduce its debt load moving forward. Nearly 17 percent of the MTA operating budget is currently devoted to debt service, a large, growing, and unsustainable ratio. |
Recommendation 15: The MTA should upgrade its fleet with battery-electric buses, entry doors on both sides of the vehicle, and optical technologies to assist with driving and bus stop entry |
| With the largest bus fleet in the nation, the MTA has significant leverage over bus manufacturers. They can demand buses to their unique specifications and even accelerate the adoption of new technologies. Moving forward, the MTA should use this buying power to upgrade the sustainability and utility of their bus fleet.
The vast majority of MTA buses are diesel and hybrid diesel. While the upfront cost of these vehicles is cheaper than battery-electric buses (BEBs), their fuel expenses can make them more expensive over the life-cycle. Recognizing these operational savings (and environmental benefits), Vancouver, BC, Los Angeles, and Seattle have committed to exclusively purchasing zero-emissions buses by 2025.[lxxxi] The MTA should make a similar (if not more ambitious) commitment. Additionally, the MTA should begin purchasing buses with doors on both sides of the vehicle, not just the right side. This will ease the roll-out of fully-protected, mid-street bus lanes, which are often easier to design and implement if passengers can board from the left side. Finally, the MTA should invest in buses with optical guidance features. This would be particularly helpful when entering and exiting bus stops, helping drivers pull up at a precise location and an optimal distance from the curb. |
Recommendation 16: With assistance from the City, the MTA should build more bus terminals. This will reduce the number of buses terminating on the street and increase curb space |
| In areas where numerous bus routes begin and terminate – like Flushing, Queens – the City should work with the MTA and developers to build new bus terminals, in collaboration with surrounding communities. This will relieve overcrowded sidewalks, reduce conflicts with private vehicles, provide dedicated facilities for drivers (namely bathrooms), and relinquish highly valued curb space to delivery trucks, private automobiles, taxis, and for-hire vehicles (FHVs).
Over the last decade, the city’s neighborhoods have become more densely populated, app-based FHVs have grown more prevalent, online shopping has increased in popularity, and the number of restaurants and grocery stores has expanded. As a result, FHVs and delivery trucks are clamoring for curb space and, too often, illegally occupying spaces where buses pick-up passengers and park at the end of their routes. By blocking buses from accessing their stops, this has led to significant delays. The creation of off-street terminals, then, will both improve the speed and reliability of buses and improve the circulation of non-bus traffic. The Department of City Planning and the Economic Development Corporation should conduct a full scan of City and non-City properties, identifying those appropriate for new bus terminals. The DCP should also include bus terminal inquiries in its rezoning studies and environmental impact assessments and actively work with developers of large-scale spaces (like retail outlets) to incorporate bus terminals into their site planning. The City can look to London and Hong Kong for inspiration. |
Recommendation 17: The MTA should consider building more bus depots and should better coordinate the depot operations of the MTA Bus Company and NYCT Bus |
| In addition to terminals, the City can help facilitate the siting and construction of new depots, where buses are stored and maintained. Existing depots are scattered around the far reaches of the five boroughs, forcing some buses to travel a long distance to and from their route. These facilities are also unevenly distributed, with Queens (10 depots) having nearly as many as Brooklyn and Manhattan combined (11 depots).
Exacerbating this issue, the MTA Bus Company and New York City Transit Bus operate separate depots. This leaves some NYCT buses, for instance, traveling a farther distance to and from their route rather than being stored and maintained at a more proximate MTA Bus Company depot. This is highly inefficient. As part of a broader integration of the two bus companies, any distinction between depots should be eliminated and all buses should be serviced at the depot closest to their route. |
Legibility and Amenities
In addition to being frequent, reliable, speedy, and connective, a bus system should be safe, clean, comfortable, and easy to use. Agencies that do not provide a basic level of civility and legibility will struggle to attract and retain ridership.
A straphanger’s first engagement with the bus system occurs at the bus stop. It should be clearly marked and simple to locate, provide easy to understand information about routes and bus arrivals, offer cover from the elements, and have a place to sit.
In New York, responsibility for these bus stops is largely in the hands of the City, which oversees bus shelters via a franchise agreement with JCDecaux that governs street furniture. Of the 15,000-plus bus stops across the five boroughs, only 3,364 have shelters, or 22 percent of the total (see Chart 21).[lxxxii] Staten Island has the smallest share of bus stops with shelters (12 percent), followed by Queens (20 percent), Brooklyn (21 percent), Bronx (28 percent), and Manhattan (32 percent).
Chart 21: Share of bus stops with shelters
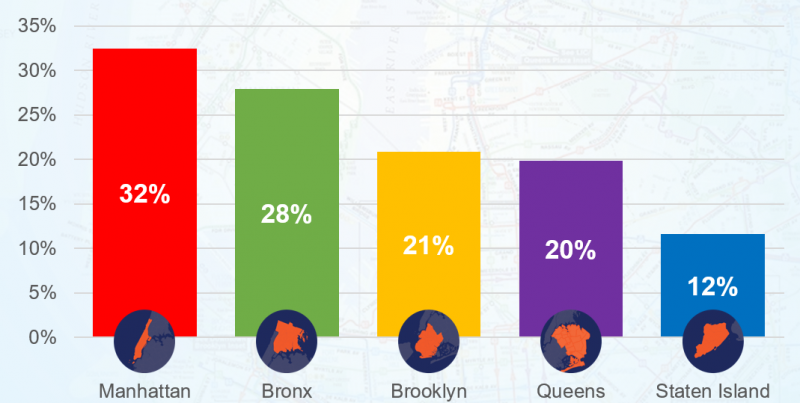
Bus Stop Shelters. NYC Open Data.
While this is generally in compliance with the franchise agreement, it is clearly insufficient. Bus shelters are important beacons for the system and essential for communicating information about local service—including real-time information on bus arrivals and maps of the network. A legible bus system is impossible without prevalent and well-appointed shelters.
Recommendation 18: The City should expand the number of bus shelters throughout the five boroughs and better design curbs and sidewalks to mark bus stops and routes |
| To provide a more comfortable transit experience, particularly for the elderly and disabled, the City should increase the number of bus shelters located throughout the five boroughs. This can be done in conjunction with JCDecaux or, because it is a non-exclusive contract, another franchisee. All bus shelters should feature a map of local routes, helping riders locate transfer points and identify the best path to reach their desired destination.
The City should also intervene at the curb-level, particularly at locations without bus shelters. Relevant route numbers can be painted on the curb or sidewalk of all bus stops and, with smart design, help communicate the frequency and direction of the route. Meanwhile, all LinkNYC beacons in close proximity to stops should provide real-time bus arrival information. This should be accompanied by an update to the MTA’s Bus Time app. At the moment, it is available only in English, despite 27 percent of riders having limited English proficiency.[lxxxiii] |
Recommendation 19: The MTA and City should work to improve the legibility of the bus system by renaming routes, eliminating spurs, and running routes on the same streets in both directions |
| Bus routes and their names can be a source of confusion. While the M42, M72, and M96 run on 42nd Street, 72nd Street, and 96th Street, the M31, M100, B37, and Q69 run a far distance from their respective street numbers. Aligning—where possible—bus names with their local geography can improve the intuitiveness of the system.
Bus spurs too, breed confusion. The M34A and M34, M14A and M14D, and the Q20A and Q20B share the same roads until the very end of their routes, when they branch in different directions. Splitting these spurs into separate routes will help riders avoid frustrating mistakes. The City can also contribute to the legibility of routes. Due to the abundance of one-way streets throughout the five boroughs, many bus routes will travel out-bound on one road and in-bound on another blocks away. This confuses the numbering of routes—the M12 travels northbound on 12th Avenue and southbound on 11th—and can make it more difficult to locate a desired bus. Where feasible, the City should convert one-way streets to two-way streets along bus routes to make them simpler. |
Appendices
Appendix 1: Retail, Restaurant, Health, Hotel, and Cultural Employment
in underserved neighborhoods
| Neighborhood | Retail | Food Services & Accommodations | Health Care & Social Services | Arts, Entertainment, & Recreation |
| Clinton | 3,479 | 10,938 | 2,834 | 4,470 |
| JFK and LaGuardia | 1,502 | 4,008 | 79 | 4 |
| Williamsburg (aka North Side-South Side) |
1,932 | 4,349 | 4,101 | 773 |
| Van Nest-Morris Park-Westchester Square | 1,000 | 785 | 11,454 | 89 |
| Norwood | 706 | 292 | 14,627 | 62 |
| Greenpoint | 1,446 | 1,347 | 1,321 | 176 |
| Richmond Hill | 975 | 461 | 6,629 | 17 |
| Carroll Gardens-Columbia Street-Red Hook | 1,945 | 1,747 | 1,626 | 170 |
| College Point | 945 | 260 | 2,331 | 14 |
| Jackson Heights | 3,103 | 1,800 | 2,567 | 65 |
| Sheepshead Bay-Gerritsen Beach-Manhattan Beach | 1,881 | 982 | 5,516 | 71 |
| Glen Oaks-Floral Park- New Hyde Park |
363 | 409 | 10,182 | 82 |
| Homecrest | 1,575 | 570 | 5,259 | 232 |
| Typical NYC Neighborhood | 829 | 530 | 1,999 | 44 |
United States Census Bureau. “LEHD Origin-Destination Employment Statistics.” 2015.
Appendix 2: Bus service drop-off in neighborhoods with large service sector
| Neighborhood | Restaurant, Retail, Health, Hotel, and Cultural Employment | Total Employment | Ratio | AM Peak Buses /Hour | Late Evening Buses/Hour | Decline in Evening Service |
| Midtown-Midtown South | 171,080 | 719,022 | 24% | 569 | 204 | -64% |
| Hudson Yards-Chelsea-Flat Iron-Union Square | 66,345 | 228,748 | 29% | 436 | 157 | -64% |
| SoHo-TriBeCa-Civic Center-Little Italy | 49,697 | 151,287 | 33% | 196 | 67 | -66% |
| Lenox Hill-Roosevelt Island | 41,427 | 56,306 | 74% | 242 | 117 | -52% |
| Battery Park City-Lower Manhattan | 37,605 | 198,073 | 19% | 282 | 83 | -71% |
| West Village | 36,288 | 84,095 | 43% | 235 | 120 | -49% |
| Upper East Side-Carnegie Hill | 34,060 | 65,898 | 52% | 330 | 148 | -55% |
| Turtle Bay-East Midtown | 30,194 | 181,013 | 17% | 396 | 127 | -68% |
| Borough Park | 28,203 | 45,762 | 62% | 120 | 67 | -45% |
| Murray Hill-Kips Bay | 25,970 | 124,792 | 21% | 564 | 178 | -69% |
| Clinton | 21,721 | 65,820 | 33% | 146 | 44 | -70% |
| Lincoln Square | 21,631 | 46,303 | 47% | 128 | 69 | -46% |
| Upper West Side | 21,054 | 35,902 | 59% | 190 | 93 | -51% |
| East Village | 19,590 | 24,902 | 79% | 220 | 106 | -52% |
| Forest Hills | 18,673 | 29,070 | 64% | 175 | 65 | -63% |
| Park Slope-Gowanus | 18,180 | 30,872 | 59% | 130 | 55 | -58% |
| Flushing | 18,039 | 29,055 | 62% | 379 | 162 | -57% |
| East Harlem South | 17,939 | 26,449 | 68% | 230 | 104 | -55% |
| DUMBO-Vinegar Hill-Downtown Brooklyn-Boerum Hill | 16,415 | 42,929 | 38% | 246 | 105 | -58% |
| Norwood | 15,687 | 16,473 | 95% | 148 | 68 | -54% |
| Washington Heights South | 14,503 | 18,437 | 79% | 298 | 130 | -56% |
| Jamaica | 13,480 | 20,614 | 65% | 600 | 265 | -56% |
| Van Nest-Morris Park-Westchester Square | 13,328 | 20,264 | 66% | 150 | 74 | -51% |
| Sunset Park West | 13,216 | 28,376 | 47% | 214 | 68 | -68% |
| Hunters Point-Sunnyside-West Maspeth | 13,213 | 72,217 | 18% | 199 | 76 | -62% |
| Chinatown | 12,543 | 20,246 | 62% | 127 | 51 | -60% |
| Midwood | 11,371 | 17,128 | 66% | 190 | 86 | -55% |
| Elmhurst | 11,232 | 14,608 | 77% | 255 | 117 | -54% |
| North Side-South Side | 11,155 | 27,193 | 41% | 142 | 73 | -49% |
| Glen Oaks-Floral Park-New Hyde Park | 11,036 | 12,121 | 91% | 114 | 39 | -66% |
Jobs: United States Census Bureau. “LEHD Origin-Destination Employment Statistics.” 2015. Bus Frequencies: NYCT Bus and MTA Bus Company. “Static Data Feeds: General Transit Feed Specification,” MTA. January 2017.
Acknowledgements
Comptroller Scott M. Stringer thanks Adam Forman, Associate Policy Director and the lead author of this report. He also recognizes the important contributions made by David Saltonstall, Assistant Comptroller for Policy; Jacob Bogitsh, Policy Analyst for Economic Development; Angela Chen, Senior Web Developer and Graphic Designer; Archer Hutchinson, Web Developer and Graphic Designer; Antonnette Brumlik, Web Site Administration; Zachary Schechter-Steinberg, Deputy Policy Director; Tammy Gamerman, Director of Budget Research; Tyrone Stevens, Press Secretary; and Devon Puglia, Director of Communications; and Elizabeth Bird, Policy Analyst.
Endnotes
[i] For routes and stops: “Static Data Feeds: General Transit Feed Specification,” New York City Transit Bus and Bus Company. January 2017.
For buses: National Transit Database, “Revenue Vehicle Inventory: Active Fleet Vehicles,” Federal Transit Administration. 2016.
For Ridership: HR&A. “2016 NYC Tech Ecosystem,” October 2017.
[ii] “Average Weekday Ridership” MTA New York City Transit and MTA Bus Company.
[iii] New York City DOT and MTA. “Introduction to Bus Rapid Transit Phase II,” September 2009.
[iv] Freeman, Neil. “NYC Bus Performance API.” http://api.busturnaround.nyc/
[v] United States Census Bureau. 2000 Census and ACS 2011-2015 5-Year Estimates.
[vi] For routes and stops: “Static Data Feeds: General Transit Feed Specification,” New York City Transit Bus and Bus Company. January 2017.
[vii] “MTA New York City Transit and MTA Bus Company System-wide Service Standards.” http://web.mta.info/mta/compliance/titlevi-subway-bus-service.html
[viii] “General Transit Feed Specification.” New York City Transit Bus and Bus Company.
[ix] MTA Transit & Bus Committee Meeting.
[x] Metropolitan Transportation Authority. “Northeast Queens Bus Study,” September 2015.
[xi] For route length: “General Transit Feed Specification.” New York City Transit Bus and Bus Company.
For turns: Bus Timetable for each individual route.
[xii] MTA Transit & Bus Committee Meeting. March 2017 to October 2017.
[xiii] National Transit Database. “Metrics,” 2015. Includes “bus,” “commuter bus,” and “bus rapid transit” services.
[xiv] National Transit Database, “Service,” Federal Transit Administration. 2016.
[xv] Rubinstein, Dana. “With faster buses, de Blasio promises to ease life in a tough city,” Politico. October 20, 2017.
[xvi] Mundy, Deborah, Mark Trompet, Judith M Cohen, Daniel J Graham. “The identification and management of bus priority schemes,” Imperial College of London. April 2017.
[xvii] New York City DOT. “Green Means Go: Transit Signal Priority in NYC.” July 2017.
[xviii] “Average Weekday Ridership” MTA New York City Transit and MTA Bus Company.
Pre-2011 ridership data for the Bx12, M15, M34/34A from: NYCDOT and MTA. “Select Bus Service: Background and Context,” NYU Rudin Center. April 9, 2013.
[xix] For wait assessment data: MTA Transit & Bus Committee Meeting. For speed data NYC Bus Performance API
[xx] NYC Open Data, “Bus Stop Shelters,” August 22, 2017.
[xxi] Employment data: New York State Department of Labor, “Quarterly Census of Employment and Wages.”
Population data: United States Census, “American Community Survey.”
Tourism data: NYC & Company, “NYC Travel & Tourism Visitation Statistics.”
[xxii] Metropolitan Transportation Authority. “MTA 2017 Adopted Budget: February Financial Plan, 2017 – 2020,” February 2017.
“General Transit Feed Specification,” New York City Transit Bus and Bus Company.
[xxiii] Metropolitan Transportation Authority. “MTA 2017 Adopted Budget: February Financial Plan, 2017 – 2020,” February 2017.
[xxiv] MTA, “MTA Adopted Budget,” 2007 to 2017.
[xxv] NYCT Bus emerged in two phases: first in 1953, when it took over bus routes from the New York City Board of Transportation, and then in 1962, when it assumed control over bus operations from two private companies. The MTA Bus Company was created decades later, in September 2004, with the merger of seven private bus companies previously under franchise agreements with the City of New York. (Metropolitan Transportation Authority. “Northeast Queens Bus Study,” September 2015.)
[xxvi] De Blasio, Bill, “One New York, Rising Together,” 2013.
[xxvii] Quarterly Census of Employment and Wages
[xxviii] United States Census Bureau. 2000 Census and ACS 2011-2015 5-Year Estimates.
[xxix] United States Census Bureau. “LEHD Origin-Destination Employment Statistics.” 2015.
Includes only private sector employment, where location of work – rather than simply the location of the payroll office – is more accurate tracks.
[xxx] United States Census Bureau. American Community Survey 2011-2015 5-Year Estimates.
[xxxi] These demographic figures are only for those commuting to work. Looking more broadly, a recent MTA study reported that 11.2% of NYCT Bus passengers are seniors and disabled and 11.4% are students.
[xxxii] “Healthcare” (NAICS code 62) also includes social assistance. “Culture” (NAICS code 71) includes arts, entertainment, and recreation.
[xxxiii] National Transit Database. “Metrics,” 2015.
[xxxiv] ibid
[xxxv] “MTA New York City Transit and MTA Bus Company System-wide Service Standards.”
Note: MTA Bus abides by different, and less clearly defined, service standards “as a result of their dissimilar service area densities and operational characteristics.”
[xxxvi] United States Census Bureau. “LEHD Origin-Destination Employment Statistics.” 2015.
[xxxvii] Among the city’s 189 neighborhoods, the median supports 6,944 private sector jobs. The typical neighborhood is served by thirteen bus routes with an average of nine minute headways in each direction during morning rush hour – so that 174 buses pass through the average neighborhood during AM peak.
Across the city there are seven neighborhoods with more than double the median number of jobs, but are served by fewer buses (and subway lines) than the city average. An additional five neighborhoods support more than 50 percent the median number of jobs, but also suffer below-average bus frequencies. The two Queens airports, meanwhile, collectively support over 40,000 jobs, but are serviced by only ten bus routes.
[xxxviii] Mills, Tom and Madeline Steele. “In Portland, Economic Displacement May Be A Driver of Transit Ridership Loss,” TransitCenter. November 14, 2017.
[xxxix] Hovenkotter, Kirk. “Bus Network Redesigns,” TransitCenter. July 2017.
[xl] “Morning rush hour,” in this instance, includes all buses that originated between 7am and 8am. Analysis is drawn from “General Transit Feed Specification,” New York City Transit Bus and Bus Company.
[xli] Employment data from: “LEHD Origin-Destination Employment Statistics,” United States Census Bureau. Frequency data from: “General Transit Feed Specification,” New York City Transit Bus and Bus Company.
[xlii] Levy, Alon. “Why are the NYC subway’s operating costs so high?” Curbed New York. October 13, 2017.
[xliii] MTA Transit & Bus Committee Meeting. March 2017 to October 2017.
[xliv] National Transit Database, “Service,” Federal Transit Administration. 2016.
[xlv] New York City DOT and MTA. “Introduction to Bus Rapid Transit Phase II,” September 2009.
[xlvi] New York City DOT. “Infrastructure: Traffic Signals.”
[xlvii] New York City DOT and MTA. “Introduction to Bus Rapid Transit Phase II.”
[xlviii] Interview with former MTA employee.
[xlix] NYC DOT. “Green Means Go: Transit Signal Priority in NYC.” July 2017.
[l] “Waiting for the Light: Picking up the Pace on Signal Priority in NYC,” The Bus Turnaround Coalition. July 2017.
Mundy, Deborah, Mark Trompet, Judith M Cohen, Daniel J Graham. “The identification and management of bus priority schemes,” Imperial College of London. April 2017.
[li] NYC DOT. “Green Means Go: Transit Signal Priority in NYC.”
[lii] Walker, Jarrett. “Human Transit: How Clearer Thinking about Public Transit Can Enrich our Communities and our Lives,” Island Press. 2012.
[liii] “MTA New York City Transit and MTA Bus Company System-wide Service Standards.”
[liv] Both stop spacing and route length is calculate for both directions on each route and the averaged.
[lv] Speed: Freeman, Neil. “NYC Bus Performance API.” http://api.busturnaround.nyc/
Ridership: “Average Weekday Ridership” MTA New York City Transit and MTA Bus Company.
Spacing: “General Transit Feed Specification,” New York City Transit Bus and Bus Company.
[lvi] Los Angeles County Metropolitan Transportation Authority. “Transit Service Policy,” October 2015. Web. https://media.metro.net/images/service_changes_transit_service_policy.pdf
[lvii] King Country Metro. “King County Metro Service Guidelines.” July 2011. http://metro.kingcounty.gov/planning/pdf/KCMT_ServiceGuidelines_07-11-11.pdf
[lviii] KFH Group. “Guidelines Design and Placement of Transit Stops.” Washington Metropolitan Area Transit Authority. December 2009.
[lix] “SEPTA Bus Stop Design Guidelines.” Southeastern Pennsylvania Transportation Authority. October 2012.
[lx] Tanner, Brit. “Transit Stops & Stations: Stop-spacing, location, & infrastructure.” San Francisco Municipal Transportation Agency. May 2015.
[lxi] “Transit Service Guidelines.” Greater Vancouver Transportation Authority. June 2004.
[lxii] “Bus Stops Guidelines.” TriMet. July 2010.
[lxiii] “South Boston Bus Stop & Service Improvement Program.” Manhattan Bay Transportation Authority. October 2016.
[lxiv] Interview with former MTA employee.
[lxv] Metropolitan Transportation Authority. “Northeast Queens Bus Study,” September 2015.
[lxvi] MTA Bus Timetable, all routes.
[lxvii] “Chicago Transit Authority Service Standards and Policies,” Chicago Transit Authority. March 2014.
[lxviii] NYC DOT. “Bus Lanes in New York City.” www.nyc.gov/html/brt/downloads/pdf/bus_lanes_map.pdf
[lxix] Rubinstein, Dana. “With faster buses, de Blasio promises to ease life in a tough city,” Politico. October 20, 2017.
[lxx] Mundy, Deborah, Mark Trompet, Judith M Cohen, Daniel J Graham. “The identification and management of bus priority schemes,” Imperial College of London. April 2017.
[lxxi] “General Transit Feed Specification,” New York City Transit Bus and Bus Company.
[lxxii] Mundy, Deborah, Mark Trompet, Judith M Cohen, Daniel J Graham. “The identification and management of bus priority schemes,” Imperial College of London. April 2017.
[lxxiii] NYC Department of Finance. “Application For Stipulated Fine Parking Programs.” http://www1.nyc.gov/assets/finance/downloads/pdf/fleet/stipulated_fine.pdf
[lxxiv] Miller, Stephen. “Trottenberg: The Goal Is to Roll Out 13 New SBS Routes in Four Years,” Streetsblog NYC. April 25, 2014.
[lxxv] This analysis does not include the newest SBS route, the Bx6.
[lxxvi] New York City DOT and MTA. “Introduction to Bus Rapid Transit Phase II.”
[lxxvii] National Transit Database. “Revenue Vehicle Inventory: Active Fleet Vehicles,” 2015. Includes “bus,” “commuter bus,” and “bus rapid transit” services.
[lxxviii] “MTA Bus Operations Committee Meeting,” December 2012.
[lxxix] National Transit Database. “Revenue Vehicle Inventory: Active Fleet Vehicles.” 2016.
[lxxx] MTA. “New York City Transit to Add 180 New State-of-the-Art Articulated Buses,” October 25th, 2017. Web.
[lxxxi] Roberts, David. “Electric buses are coming, and they’re going to help fix 4 big urban problems,” VOX. October 25, 2017.
[lxxxii] Some additional stops have benches, but not shelters.
[lxxxiii] United States Census Bureau. American Community Survey 2011-2015 5-Year Estimates.